On May 21, 2026, the Cloud Native Computing Foundation announced something the industry had been treating as inevitable for years: OpenTelemetry graduated. That milestone confirms what adoption numbers had already been signalling — it is no longer the emerging standard for observability. It is the standard, full stop. The OpenTelemetry JavaScript API package was downloaded more than 1.36 billion times in the past twelve months, and the Python API package surpassed 1.3 billion downloads, both setting new monthly records in April 2026.
For engineering teams, the debate is over. The question is no longer whether to adopt OpenTelemetry. It is whether your team implements it deliberately, with the right architecture from day one, or inherits a rushed, inconsistent rollout that costs more to fix later than it would have cost to do properly from the start. This guide covers what OpenTelemetry actually is, how its core components fit together, where implementations typically go wrong, and what its emerging role in AI observability means for the next 18 months.
What OpenTelemetry Actually Is (and What It Isn’t)
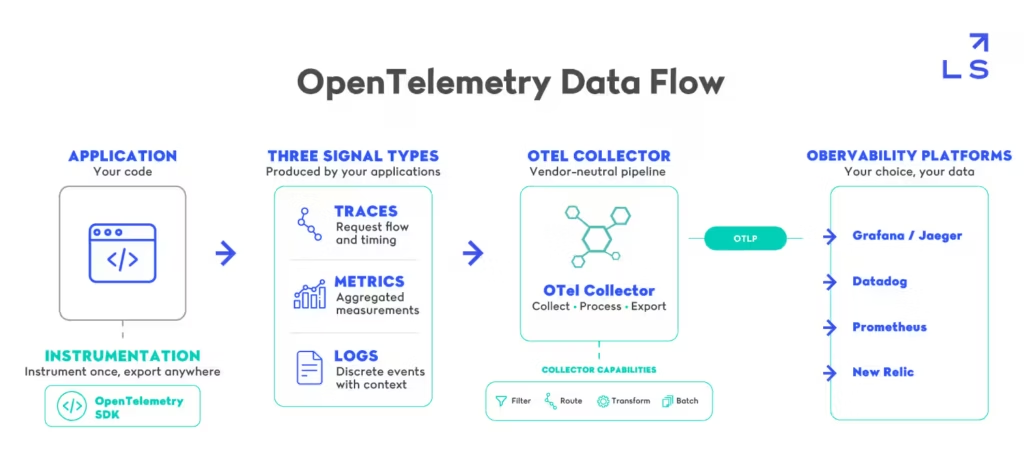
OpenTelemetry — often shortened to OTel — is a vendor-neutral, open-source framework for instrumenting, collecting, and exporting telemetry data. It is not a backend. It is not a dashboard. It is not an alerting platform. It is the layer that sits between your application code and whatever observability backend you choose to send data to — and that separation is precisely what makes it valuable. Most of the confusion teams run into early on comes from expecting OpenTelemetry to do more than that single, well-defined job.
That narrow scope is deliberate, not a limitation. By refusing to be a backend, a UI, or an alerting engine, OpenTelemetry avoids competing with the tools teams already rely on for those jobs — instead, it standardises the part that sat underneath all of them inconsistently for years: how telemetry gets captured and described in the first place. Once you see OpenTelemetry as infrastructure rather than a product, the rest of its design decisions — the SDK, the Collector, the semantic conventions — start to make a lot more sense.
One standard, three signal types
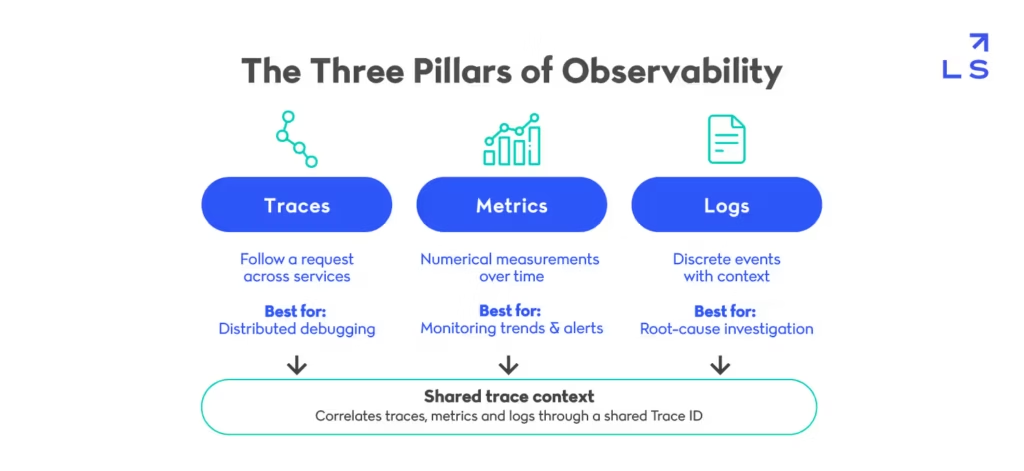
OpenTelemetry organises observability data into three signal types: traces, metrics, and logs. Traces follow a single request as it moves through a distributed system, showing you exactly where time is spent and where failures occur. Metrics capture numerical measurements over time — request counts, latencies, error rates. Logs capture discrete events with context. Before it existed, most organisations collected these three signal types using three different tools, often from three different vendors, with no shared context between them. OpenTelemetry unifies the instrumentation layer so that a trace ID can connect a log line to the exact request that generated it.
Why vendor lock-in was the problem OpenTelemetry solved
Before OpenTelemetry existed, switching observability vendors meant re-instrumenting your entire codebase. Proprietary agents and SDKs created technical debt disguised as a procurement decision — once you adopted a vendor’s instrumentation, leaving was expensive enough that most teams simply didn’t. It decouples instrumentation from backend. You instrument your code once, using the OpenTelemetry SDK, and you can export that data to Grafana, Datadog, New Relic, or any OTLP-compatible backend without touching your application code again. That single architectural decision is the reason adoption has moved as fast as it has.
The graduation milestone, and what it actually means
CNCF graduation is not a marketing label — it is the foundation’s signal that a project has reached the maturity, governance, and production-readiness bar required for enterprise adoption at scale. Organisations including Anthropic, Bloomberg, Capital One, eBay, and FICO Software already rely on OpenTelemetry in production.
The adoption data tells the same story from a different angle: combine the share of organisations already running OpenTelemetry with those actively planning to, and intent crosses 70% of the market. For engineering leaders still treating OpenTelemetry as optional, that number alone should reframe the conversation.
The Three Pillars of OpenTelemetry Observability
Each of OpenTelemetry’s three signal types solves a different visibility problem, and understanding how they work together is the foundation for any sound implementation. Treating them as three separate tools rather than three views of the same system is one of the most common ways teams undersell what OpenTelemetry can actually do for them.
Distributed traces
In a microservices architecture, a single user request might touch a dozen services before returning a response. Without distributed tracing, debugging a slow or failed request means manually correlating logs across every service involved — a process that doesn’t scale past a handful of services. OTel traces solve this by propagating a trace context across service boundaries, so every span of work, in every service, links back to the same originating request. Jaeger, one of the most widely used open-source tracing backends, adopted OpenTelemetry at its core in April 2026 specifically to close gaps in AI agent observability — a clear signal of where distributed tracing is heading next.
Metrics
OpenTelemetry’s metrics model supports counters, gauges, and histograms, and it works with both push-based and pull-based collection — which matters enormously for teams running hybrid or multi-cloud infrastructure where a single collection method rarely fits everything. The key advantage over tools like raw Prometheus scraping is that these metrics carry the same resource attributes and context as your traces and logs, so a spike in error rate metrics can be traced directly back to the specific requests causing it.
In practice, this connection changes how on-call engineers actually work. A traditional alerting setup tells you that the p99 latency on a checkout service crossed a threshold — useful, but it leaves the “why” entirely up to manual investigation. With OpenTelemetry, the same alert can carry shared trace context, letting an engineer jump from the metric directly to the exact traces contributing to that latency spike, then from those traces directly to the logs generated during those specific requests. That chain — metric to trace to log — is the practical payoff of treating all three signal types as part of one connected system rather than three separate tools that happen to describe the same infrastructure.
Logs
Logs were the last of the three pillars to reach stability in the OpenTelemetry specification, but they are now production-ready and arguably the most transformative once adopted properly. The defining feature is trace context propagation — every log line can carry the trace ID of the request that generated it. That single addition turns log search from “search and hope” into “jump directly from a slow trace to the exact log lines that explain why.” On March 19, 2026, the OpenTelemetry Specification project formally deprecated OpenTracing compatibility requirements, a housekeeping change that reflects how far the ecosystem has already moved past pre-OTel tracing standards.
The OTel Collector: The Engine Room of Your Observability Pipeline
If the SDK is how your application produces telemetry, the OpenTelemetry Collector is how that telemetry gets processed and routed before it ever reaches a backend. Everything that happens to your data between instrumentation and storage runs through this layer, which makes it the single highest-leverage point in the entire pipeline.
What the Collector does
The Collector receives telemetry data, processes it, and exports it to one or more backends. It functions as a vendor-neutral proxy sitting between your instrumented services and wherever you choose to store and visualise your data. This separation matters operationally: you can change backends, add a second backend for redundancy, or apply organisation-wide processing rules — all without touching a single application’s instrumentation code.
In practice, this is what lets a platform team make infrastructure decisions independently of what any individual product team is building. A migration from one observability vendor to another becomes a Collector configuration change rather than a months-long re-instrumentation project touching every service in the organisation.
Pipelines, processors, and exporters
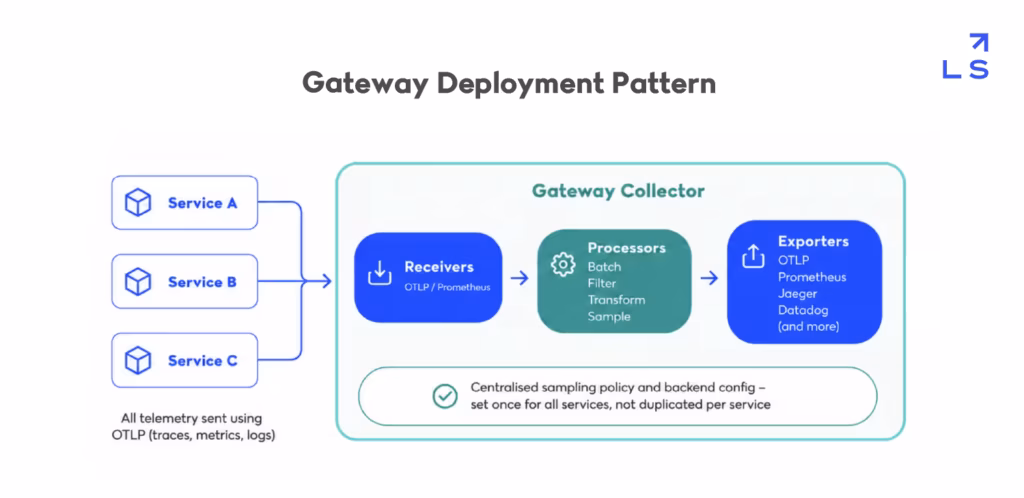
A Collector pipeline follows a simple structure: receivers accept incoming data, processors transform or filter it, and exporters send it onward. Common processors include batching for efficiency, filtering to drop noisy or irrelevant data, attribute transformation for consistency, and sampling to manage volume. On the export side, OTLP is the native protocol, but the Collector also supports exporting to Prometheus, Jaeger, Datadog, and most major observability platforms — which is exactly the vendor flexibility OpenTelemetry was built to provide.
Collector deployment patterns
Three deployment patterns dominate in practice. The sidecar pattern runs a Collector instance alongside each service instance — simple, but harder to manage centrally at scale. The agent pattern runs one Collector per host, serving all services on that host. The gateway pattern centralises Collector instances as a dedicated tier that all services send data to — this is the recommended approach for most teams beyond a handful of services, because it centralises sampling policy, processing rules, and backend configuration in one place rather than duplicating that configuration everywhere.
A practical migration path most teams follow looks like this: start with the agent pattern during initial rollout, since it requires the least architectural change and gives you a working pipeline within days rather than weeks. Once you have two or more services reporting reliably, introduce a gateway tier and redirect agents to send data there instead of directly to your backend.
This staged approach avoids the common trap of designing the “ideal” centralised architecture upfront, before you have real traffic patterns to validate sampling rates and processing rules against. Teams that skip straight to a gateway pattern without this validation step often end up reconfiguring it twice — once for the architecture they guessed at, and once for the architecture their actual data volume required.
Choosing what to send where
Not every backend needs every signal. A common and often overlooked pattern is routing traces to a tracing-optimised backend like Jaeger or Tempo, sending metrics to a time-series database like Prometheus or Mimir, and forwarding logs to a dedicated log aggregation platform — all from the same Collector pipeline, using different exporters for each signal type. This avoids forcing a single backend to handle workloads it wasn’t optimised for, while still keeping a single, vendor-neutral instrumentation layer feeding all three. It is one of the clearest practical advantages of decoupling instrumentation from backend in the first place.
Implementing OpenTelemetry: Where Teams Get It Wrong
OpenTelemetry’s flexibility is also where most implementation problems start. The framework gives you enormous freedom in how you instrument, sample, and route data — and that freedom punishes teams that don’t make deliberate architectural decisions early. The same flexibility that lets OpenTelemetry fit virtually any stack also means there’s no default path nudging teams toward the right one.
Instrumenting everything at once
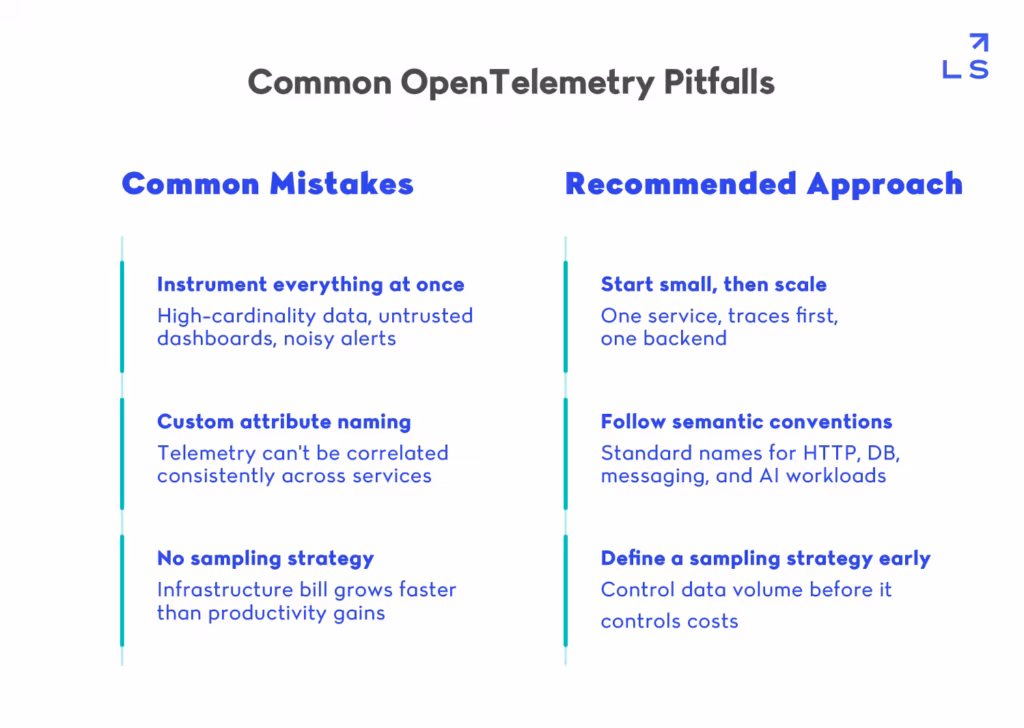
The most common mistake is treating adoption as a single big-bang rollout. Teams instrument every service, every signal type, and every backend integration simultaneously — and end up with high-cardinality data they can’t afford to store, dashboards nobody trusts yet, and alerts tuned on incomplete baselines. The more sustainable approach is to start with one service, one signal type — traces are usually the highest-value starting point — and one backend. Validate that the pipeline produces useful, trustworthy data before expanding scope. This is the same discipline event-driven systems require when introducing new message types into a live pipeline: prove the pattern at small scale before it becomes load-bearing infrastructure.
Skipping semantic conventions
OpenTelemetry’s semantic conventions define standard attribute names for HTTP requests, database calls, messaging systems, and — as of 2026 — AI workloads. Teams that skip semantic conventions and invent their own attribute naming end up with telemetry that can’t be correlated consistently across services, which defeats much of the point of adopting a unified standard in the first place. GenAI semantic conventions are being finalised this year specifically to standardise how teams instrument LLM-based systems — covering tasks, actions, agents, token costs, and memory — which matters enormously for any team now building agentic workflows alongside traditional services.
Underestimating data volume and cost
The cost benefits of OpenTelemetry are real and well documented — 57% of organisations report reduced costs after adopting it over proprietary tooling, and Forrester estimates savings of up to 50% versus proprietary platforms. But those savings depend entirely on sampling and retention decisions made early.
Telemetry data volume keeps growing — IoT, edge computing, and AI workloads all generate signals at a rate that can outpace whatever optimisation gains you’ve banked. Sampling strategy is not a tuning detail to revisit later. It is a core architectural decision that determines whether your observability pipeline scales with your systems or becomes the thing your systems can’t afford to run alongside. Teams that have already built strong DevSecOps practices into their pipelines tend to extend that same rigour naturally to telemetry governance — treating data retention and access policy as security decisions, not just cost ones.
OpenTelemetry and AI: The Next Frontier
Why AI systems need observability too
AI agents and LLM-based pipelines fail in familiar ways — latency spikes, unexpected errors, degraded output quality — but they’re harder to debug without structured telemetry, because the failure often lives inside a reasoning chain rather than a clean stack trace. OpenTelemetry’s GenAI semantic conventions extend the same tracing and metrics model that works for distributed systems to cover tasks, actions, agents, teams, artifacts, and memory — giving teams a standard way to debug reasoning chains, track token costs, and meet emerging compliance requirements around AI system behaviour.
What this means for engineering teams in 2026
Frameworks including LangGraph, CrewAI, AutoGen, and IBM’s Bee Stack are converging on OpenTelemetry semantic conventions for exactly this reason — a fragmented observability landscape for AI systems would recreate the same vendor lock-in problem OpenTelemetry was built to solve for traditional infrastructure. Teams building agentic systems without instrumenting from day one are setting themselves up for the same retrofitting pain that distributed systems teams faced before OpenTelemetry existed. The production challenges already documented around scaling AI agents in software development — cost visibility, agent-to-agent communication, debugging autonomous decisions — are, at their core, observability problems, and OpenTelemetry is rapidly becoming the standard answer to them.
This convergence is worth watching closely over the next year, because whichever instrumentation standard the major agent frameworks settle on by default will likely become the one every new framework adopts afterward — the same network effect that made OpenTelemetry itself the obvious choice once enough vendors had already committed to it.
OpenTelemetry Is No Longer a Choice — It’s Infrastructure
CNCF’s graduation announcement didn’t create OpenTelemetry’s dominance — it confirmed something the download numbers, the vendor consolidation, and the semantic conventions work had already been showing for two years. The standard has won. What remains an open question, for every individual engineering team, is whether OpenTelemetry gets implemented deliberately — with the right starting scope, the right semantic conventions, and the right sampling strategy — or whether it gets bolted on reactively once an incident makes the absence of good telemetry impossible to ignore.
The teams that get the most value from OpenTelemetry are not the ones that adopted it first. They are the ones that treated the rollout as an architectural decision rather than a checkbox, starting narrow, validating early, and scaling deliberately. That distinction tends to matter more than which vendor or platform sits behind the Collector.
If your team is evaluating how to build the right observability foundation — or the right engineering capability around it — Landskill can get you there in a human, colaborative and productive environment. Check out our services and learn more about our team, and let’s work together!