Performance issues in JavaScript applications rarely appear at the beginning. Early versions of a product are often fast enough, responsive enough, and simple enough that performance feels like a solved problem. As applications grow, however, JavaScript performance begins to degrade in ways that are harder to predict, harder to measure, and harder to fix.
What changes is not just the amount of code being shipped, but the context in which that code runs. More users, more devices, more data, and more features place sustained pressure on the frontend. Decisions that once felt harmless—adding another dependency, expanding shared state, increasing build complexity—start to accumulate real costs. Over time, JavaScript performance issues emerge not as isolated bottlenecks, but as systemic failures across build pipelines, runtime execution, and application architecture.
This pattern is well documented in real-world performance research. Modern performance metrics increasingly focus on user-centric outcomes such as responsiveness and interactivity, rather than isolated technical measurements. In parallel, studies of JavaScript execution show that startup cost and main-thread work become dominant factors as applications scale, particularly on lower-powered devices.
This article examines JavaScript performance from a systems perspective. Instead of focusing on individual optimizations or tool-specific tricks, it looks at what actually breaks when JavaScript applications grow large: where performance debt accumulates, why it often goes unnoticed, and how architectural and tooling decisions amplify or mitigate those effects. The goal is to help teams reason about JavaScript performance at scale, before performance issues become structural and expensive to reverse.
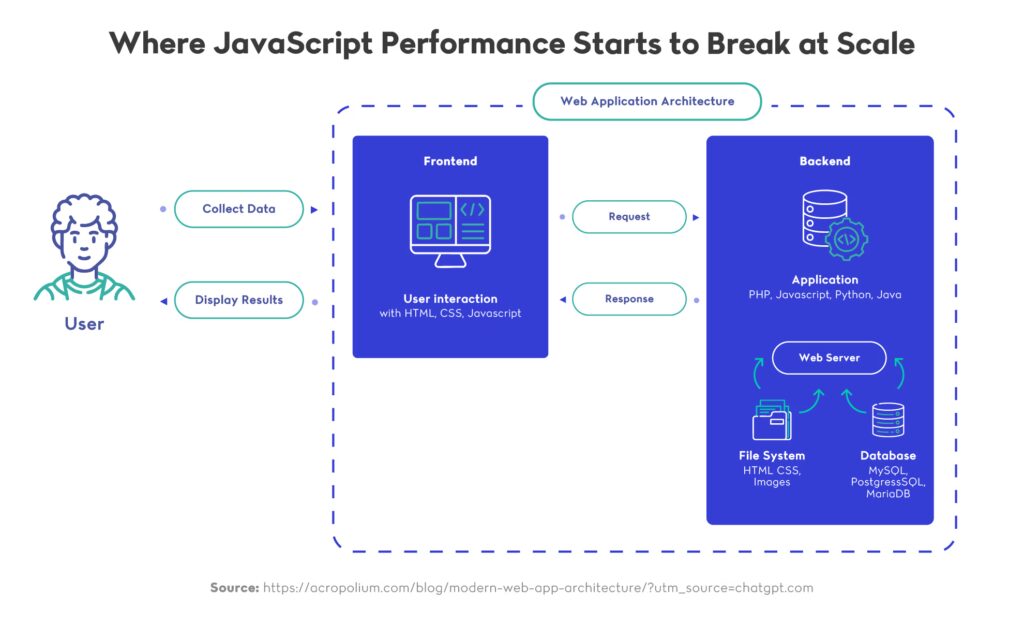
At scale, JavaScript performance issues often emerge from the interaction between frontend architecture, backend responses, and execution under load rather than from isolated lines of code.
1. Why JavaScript Performance Degrades as Applications Grow
1.1 Performance feels fine until it suddenly doesn’t
In the early stages of an application, JavaScript performance problems are rarely visible. Codebases are small, user flows are limited, and performance testing usually happens on modern developer machines. Under these conditions, even inefficient patterns can appear acceptable, and performance is implicitly treated as a future concern.
The issue is that JavaScript performance does not degrade linearly. As features accumulate, the cost of additional logic, dependencies, and shared state compounds. What once felt fast enough can become fragile under real usage, especially when applications are accessed on slower devices or constrained networks. By the time performance issues are obvious, they are often deeply embedded in the system.
1.2 Scale changes the execution context
As applications grow, JavaScript runs in a fundamentally different environment. More users generate more concurrent interactions, more data flows through the frontend, and more code executes during startup and during user interaction. These changes shift JavaScript performance from a local concern to a systemic one.
At scale, frontend code competes more aggressively for CPU time, memory, and network resources. Startup cost increases as bundles grow, long tasks become more frequent, and rendering work becomes harder to reason about. Many of these effects are well understood in web performance engineering, where performance is treated as a property of the entire system rather than isolated code paths.
1.3 Growth exposes hidden performance debt
Many performance problems are introduced long before they are felt. Decisions such as adding large dependencies, centralizing state indiscriminately, or tightly coupling features can introduce performance debt that remains invisible for months. As long as the application remains small, these costs stay hidden.
When scale arrives, that debt surfaces quickly. Build times increase, interactions feel less responsive, and attempts to optimize individual hotspots deliver diminishing returns. At this stage, JavaScript performance issues are no longer isolated defects but symptoms of structural decisions made earlier in the life of the application.
2. Build-Time Performance: Where Slowdowns Start
2.1 Build speed degrades long before runtime performance
In many large applications, JavaScript performance problems begin before any code reaches the browser. As projects grow, build pipelines accumulate configuration, plugins, and transformations that slow down feedback loops. What starts as a fast development setup gradually becomes a source of friction, increasing the time it takes to validate changes and ship updates.
This slowdown is often dismissed as a tooling inconvenience, but it has deeper consequences. Slow builds discourage experimentation, reduce iteration speed, and make performance regressions harder to detect early. Over time, degraded build performance becomes a structural problem that affects how teams work and how confidently they can evolve the codebase.
2.2 Bundle growth and its downstream impact
As features accumulate, bundle size tends to grow steadily. New dependencies are added, shared utilities expand, and code paths that were once optional become part of the critical path. Even when individual changes seem small, their combined effect increases both build complexity and the amount of JavaScript shipped to users.
This growth directly affects JavaScript performance at runtime. Larger bundles increase parse and execution time, particularly on lower-powered devices, and they amplify the cost of every render and interaction. Build-time decisions therefore have a direct and lasting influence on user-facing performance, even if the build process itself feels removed from runtime concerns.
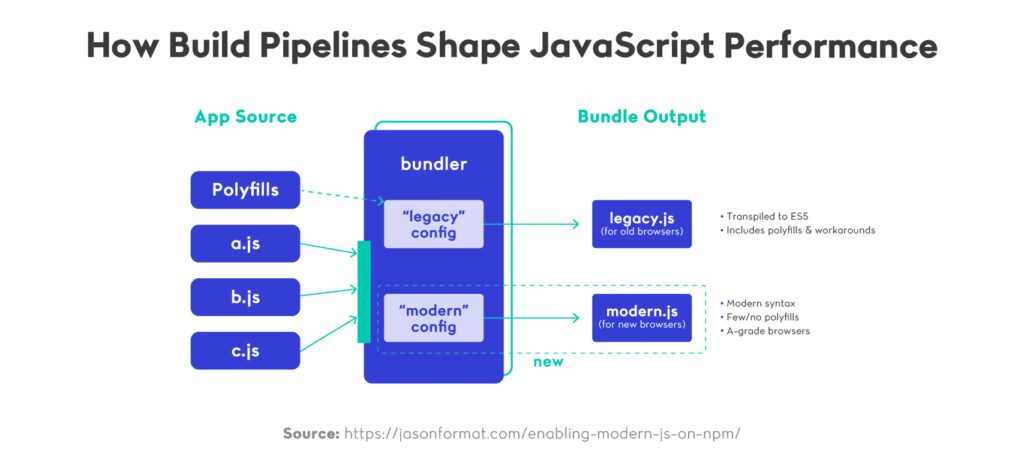
Many of these issues stem from how bundlers, transpilers, and build tools are configured and combined. As discussed in JavaScript bundlers, transpilers, and the modern toolchain, tooling choices shape not only build output but also the performance characteristics of the resulting application.
2.3 Tooling complexity creates hidden performance risk
Modern frontend tooling offers flexibility and power, but that flexibility comes at a cost. Complex build setups can obscure where performance problems originate, making it difficult to understand why builds slow down or why output size increases. Over time, teams may compensate by adding more tooling rather than simplifying existing systems.
This compounding complexity creates hidden performance risk. When build pipelines become hard to reason about, performance regressions are more likely to slip through unnoticed. JavaScript performance issues that surface in production often trace back to build-time assumptions that were never revisited as the application scaled.
3. Runtime Performance Under Real Load
3.1 Startup cost becomes the first bottleneck
As applications grow, the cost of starting up the frontend often becomes the most visible performance problem. More JavaScript needs to be downloaded, parsed, and executed before the application is interactive. On modern development machines this overhead may appear manageable, but under real-world conditions it quickly becomes a source of user-facing delay.
At scale, startup work accumulates across frameworks, libraries, and application code. Even small increases in bundle size can significantly affect time to interactivity, particularly on lower-powered devices. This is often where JavaScript performance issues are first noticed by users, even if the application feels responsive once it has fully loaded.
3.2 Main-thread contention and interaction latency
Once an application is running, runtime execution shifts from startup concerns to sustained interaction. User input, rendering, state updates, and background work all compete for time on the main thread. As complexity increases, this competition becomes harder to manage and reason about.
In large applications, JavaScript performance problems frequently manifest as inconsistent interaction latency rather than complete failure. Clicks feel delayed, animations stutter, and UI updates become less predictable. These effects are closely tied to long-running tasks that block the main thread and delay user interaction, a behavior formally described by the Long Tasks API.
3.3 Performance issues hide in everyday interactions
One of the most challenging aspects of runtime behavior is that performance degradation often hides in common user flows. Navigation, form input, and scrolling may appear acceptable in isolation but degrade under sustained use or specific data conditions. Because these paths are exercised constantly, even minor inefficiencies can have a disproportionate impact.
At this stage, JavaScript performance becomes difficult to diagnose through isolated profiling alone. Problems surface as patterns rather than spikes, requiring teams to think in terms of workload distribution, execution timing, and how frequently code paths are triggered. Runtime performance issues are therefore best understood as systemic behavior rather than isolated bugs.
4. Architecture as a Performance Multiplier

4.1 Architecture shapes how performance problems scale
As JavaScript applications grow, architecture becomes one of the strongest multipliers of performance behavior. Well-defined boundaries can limit the impact of slow code, while tightly coupled systems tend to amplify even small inefficiencies. At this stage, JavaScript performance is influenced less by individual functions and more by how responsibilities are distributed across the system.
Architectural decisions determine how much code executes in response to a single user action, how often state changes propagate through the UI, and how expensive re-rendering becomes over time. When boundaries are unclear, performance problems spread easily, making optimization reactive and fragile.
4.2 Module boundaries, ownership, and execution cost
Clear module boundaries help contain execution cost. When features own their state, data access, and rendering logic, performance issues tend to remain localized. In contrast, shared global state and cross-cutting dependencies increase the likelihood that small changes trigger widespread updates.
This is why architectural patterns that emphasize isolation and ownership are often discussed in performance contexts, not just in terms of maintainability. Approaches such as modular frontends or carefully scoped micro-frontend designs are frequently explored as ways to limit the blast radius of change, particularly in large teams, as outlined in architectural discussions on frontend system composition.
4.3 When architecture outweighs optimization
In large systems, architectural constraints often outweigh the benefits of low-level optimization. Efforts to micro-optimize rendering or data processing can deliver short-term gains, but those gains are easily erased if the surrounding architecture continues to amplify work unnecessarily.
Many long-running performance problems in enterprise JavaScript applications can be traced back to early architectural shortcuts that made iteration easier at the cost of long-term efficiency. These tradeoffs are rarely obvious at the time and tend to surface only when scale forces the system beyond its original assumptions, a pattern also reflected in common JavaScript pitfalls in enterprise applications.
5. Performance Budgets and Tradeoffs at Scale
5.1 Why performance budgets exist
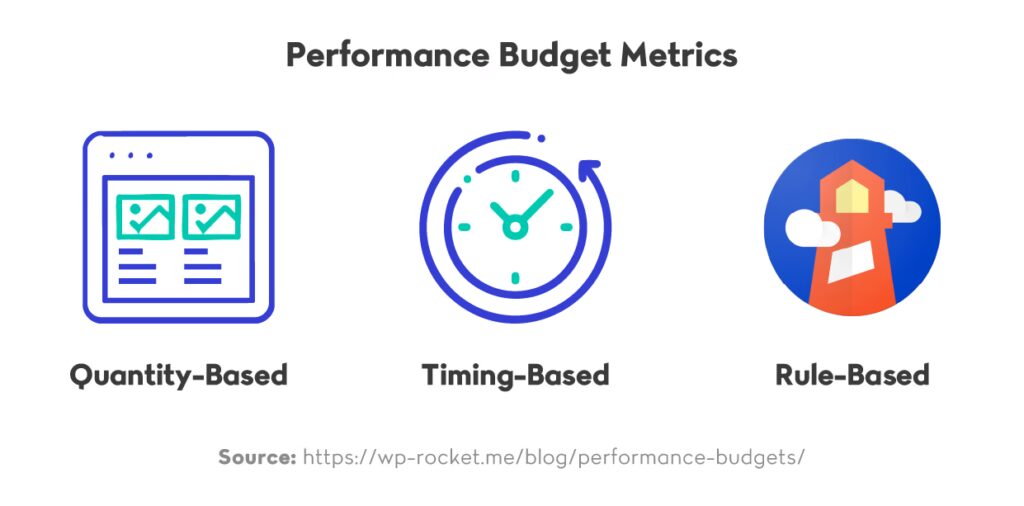
As applications mature, performance constraints stop being purely technical concerns and become organizational ones. Without explicit limits, teams tend to add features, dependencies, and tooling that slowly erode responsiveness over time. Performance budgets exist to make those tradeoffs visible before degradation reaches users. Rather than focusing on individual optimizations, budgets define acceptable boundaries for metrics such as bundle size, execution time, and interaction latency. In this sense, JavaScript performance becomes a shared responsibility, shaped by product decisions as much as engineering choices.
5.2 Budgets as alignment tools, not enforcement mechanisms
In practice, performance budgets are most effective when they act as alignment tools rather than hard gates. Teams that treat budgets as absolute blockers often work around them, while teams that use them as signals tend to have more productive conversations about scope and cost. Budgets help frame discussions around whether a new dependency, architectural change, or feature justifies its performance impact. This approach mirrors how browser teams think about user-centric metrics such as Core Web Vitals, which provide guidance without prescribing implementation details.
5.3 Tradeoffs become unavoidable at scale
As systems grow, it becomes impossible to optimize every path simultaneously. Improvements in one area often introduce cost elsewhere, whether through increased build complexity, higher runtime overhead, or reduced flexibility. Performance budgets help teams decide where those costs are acceptable and where they are not. Many large JavaScript applications struggle not because teams ignore performance entirely, but because tradeoffs are made implicitly and revisited too late. This pattern is common in enterprise environments, where tooling and architectural decisions compound over time, as discussed in Landskill’s analysis of real-world JavaScript performance optimization challenges.
Treating the JavaScript Toolchain as a System
Modern JavaScript applications are no longer shaped by isolated tooling choices or individual optimizations. Runtimes, bundlers, architectural patterns, and organizational constraints interact continuously, creating outcomes that are difficult to predict when viewed in isolation. At this level of complexity, JavaScript performance is less about tuning individual code paths and more about understanding how decisions compound across the entire system.
Throughout this article, we’ve seen how build-time choices influence runtime behavior, how architectural boundaries determine the spread of execution cost, and how performance budgets help teams make tradeoffs explicit. In practice, sustained JavaScript performance emerges from consistency and intent rather than novelty. Teams that treat tooling as a system tend to make fewer reactive decisions and are better equipped to adapt as applications and organizations scale.
The JavaScript ecosystem will continue to evolve, but the underlying challenge remains the same: balancing flexibility, speed, and maintainability under real-world constraints. Approaching JavaScript performance as a strategic concern—one that spans tooling, architecture, and team workflows—creates space for long-term improvement rather than short-lived gains. This perspective also provides a foundation for deeper exploration of specific areas, from bundler behavior to frontend architecture patterns, without losing sight of the system as a whole.