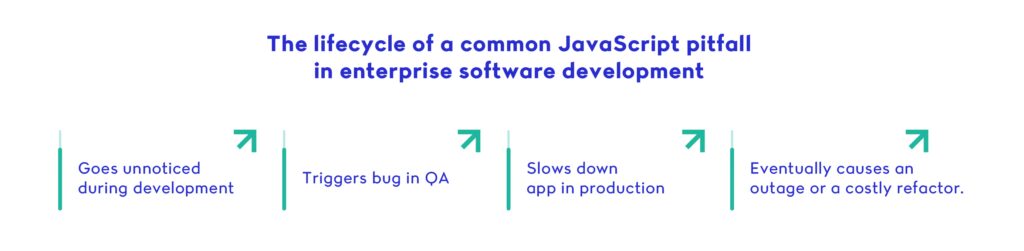
As enterprise JavaScript applications grow in complexity, so does the risk of hidden yet impactful JavaScript pitfalls. Subtle async bugs can interrupt data flows, memory leaks can silently degrade performance, and loosely managed state can lead to inconsistent behavior across teams and environments. These issues rarely appear in small projects — but in large, production-grade systems, they surface as outages, untraceable bugs, or slow, brittle user experiences.
In 2025, front-end architecture has evolved. Organizations are adopting micro frontends, shared component libraries, and performance-first frameworks like Next.js and Qwik. But even with all these advancements, developers continue to fall into familiar traps. A Medium article titled Mastering Modern JavaScript: 7 Essential Best Practices for Clean Code in 2025 highlights how persistent these problems are despite modern tooling.
This guide explores the top seven JavaScript pitfalls that often go unnoticed in large-scale enterprise environments. Each section includes a technical breakdown, a real-world example from a production project between 2023 and 2025, and clear steps to avoid or fix the issue. Whether you’re scaling a React monorepo, migrating legacy JavaScript to TypeScript, or building for long-term maintainability, recognizing these pitfalls early is essential for writing stable, scalable enterprise JavaScript.
Quick Checklist: 7 JavaScript Pitfalls to Watch for in Enterprise Apps
Use this checklist as a quick reference for the most common JavaScript pitfalls developers face in enterprise environments. Each of these issues will be explored in detail throughout the post, including technical breakdowns and real-world examples.
- Implicit type coercion – Can introduce unexpected behavior and hidden logic errors, especially in large codebases with mixed developer experience.
- Misuse of async/await inside loops – Leads to blocking behavior or incomplete async chains, often resulting in unhandled errors or performance bottlenecks.
- Unmanaged memory leaks from closures or event listeners – Accumulate over time in long-lived components, impacting browser performance and user experience.
- Overengineered or bloated state management – Adds unnecessary complexity, making debugging and onboarding harder while slowing down UI updates.
- Excessive reliance on global variables – Increases the risk of state mutation, name collisions, and unintended side effects across modules.
- Missing error handling in asynchronous code – Leaves apps vulnerable to silent failures or user-facing crashes when APIs fail or data is malformed.
- Lack of code splitting or lazy loading – Results in large JavaScript bundles, slow initial load times, and poor performance on low-end devices.
Javascript Pitfall #1: Implicit Type Coercion
One of the most subtle but dangerous JavaScript pitfalls in enterprise environments is implicit type coercion — when JavaScript automatically converts values from one type to another during operations or comparisons. While this behavior can be convenient in small scripts or rapid prototyping, it introduces silent, logic-breaking inconsistencies when used in large-scale, production-grade codebases.
Implicit type coercion typically shows up in equality checks (== instead of ===), string concatenation, boolean evaluations, and arithmetic operations involving mixed types. The JavaScript engine attempts to “guess” what the developer intended by converting one operand to match the type of another. The problem? These guesses aren’t always correct—and the bugs they cause are notoriously hard to trace.
In small applications, these quirks might cause minor annoyances. But in enterprise JavaScript systems — where dozens of developers contribute across services, modules, and domains — coercion bugs can scale into serious architectural risks. When a loosely typed comparison silently passes QA and goes to production, it can disable core features, break authentication flows, or misrepresent critical data.
This is where JavaScript pitfalls like implicit coercion become especially dangerous. These issues often don’t throw errors or warnings, making them difficult to spot in large pull requests or automated test suites. Instead, they lead to hidden behavior changes that may not surface until the system is under load or facing edge-case inputs.
Technical Breakdown: What’s Actually Happening
Let’s look at some examples that illustrate implicit type coercion:
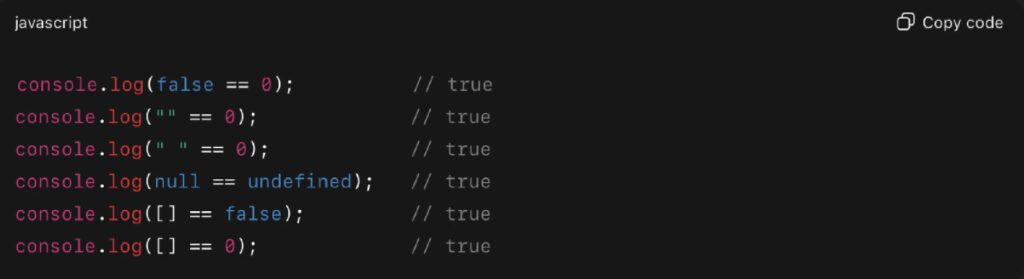
In each case, JavaScript is coercing one of the operands before making the comparison. For instance:
- Arrays are coerced into strings or numbers
- false becomes 0
- null and undefined are loosely equal but not strictly
- Empty strings behave as falsy values
Now imagine this happening :
If userId is sourced from user input or a legacy system, this comparison might fire incorrectly — potentially disabling features, showing the wrong UI, or logging a user out unnecessarily. This type of silent failure is exactly what makes JavaScript pitfalls so hard to diagnose.
Real-World Example: Production Incident
A major example of this occurred in 2023 in the Unleash feature flag platform. A logic check using loose equality caused feature flags to be incorrectly disabled for users whose config contained the string “0”. This issue led to a breakdown in platform behavior until the bug was patched and documented publicly.
In that case, implicit coercion caused a string value to behave as falsy, which led to unauthorized feature deactivations. This is one of many JavaScript pitfalls that can quietly break enterprise functionality at scale.
Tradeoffs and What to Do Instead
It’s tempting to use == for quick value checks, especially during prototyping or debugging. But in an enterprise context, you should avoid all implicit coercion by default. Here’s how:
- Always use strict equality (===) and inequality (!==) to prevent coercion
- Enforce ESLint rules like eqeqeq: “error” to catch loose comparisons
- Adopt TypeScript to define expected types and avoid ambiguity at compile time
- Pair ESLint with Prettier and CI pipelines to ensure code style consistency
- Include coercion awareness in code reviews and documentation
These practices not only help you avoid javascript pitfalls—they create clarity and predictability for every team working on the codebase.
Final Notes for Enterprise Teams
The risk with JavaScript pitfalls like implicit coercion is not just that they’re hard to see — it’s that they survive code reviews and testing unnoticed. In distributed teams, or in codebases maintained over multiple years, these bugs accumulate quietly until something mission-critical fails.
Avoiding JavaScript pitfalls means standardizing how your team handles types, comparisons, and logic. The upfront cost of being explicit is minimal. The long-term cost of ignoring coercion can be enormous — impacting user experience, platform stability, and your engineering reputation.
Javascript Pitfall #2: Misuse of async/await in Loops
A common but costly mistake in modern enterprise development is the misuse of async/await inside loops. It might appear intuitive to await an asynchronous task during iteration, but in many cases, this leads to serial execution, performance bottlenecks, or unhandled errors. Among JavaScript pitfalls, this one is especially dangerous because the resulting bugs don’t break the code — they slow it down, degrade throughput, or silently fail in production.
Why It Matters in Enterprise JavaScript
In enterprise JavaScript environments, it’s typical to abstract workflows — like batch processing or API integration — into reusable async logic. But when those abstractions rely on awaiting inside loops, especially using constructs like forEach, the impact compounds quickly: what should be parallel becomes sequential, and what should be fast becomes sluggish.
This is one of those JavaScript pitfalls that doesn’t show up in test coverage or local dev tools. It quietly affects real users under production loads, making async behavior unpredictable and pipelines harder to scale.
Technical Breakdown: What’s Actually Happening
Here’s a common but flawed example:
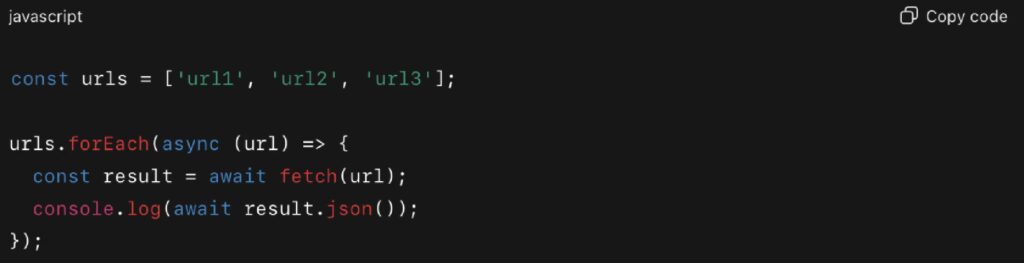
This might look correct, but it introduces several hidden issues:
- forEach does not await the async callback
- The loop completes immediately, even if fetches haven’t resolved
- Unhandled rejections may be lost entirely
- Results are logged in an unpredictable order
To fix it, the solution depends on your intended control flow:
Option 1: Sequential execution (maintain order or rate limits)
Option 2: Parallel execution (maximize speed)
This kind of misuse sits high on the list of JavaScript pitfalls because the syntax appears clean and safe. But behind the scenes, you end up with blocked loops, inflated response times, and incomplete executions.
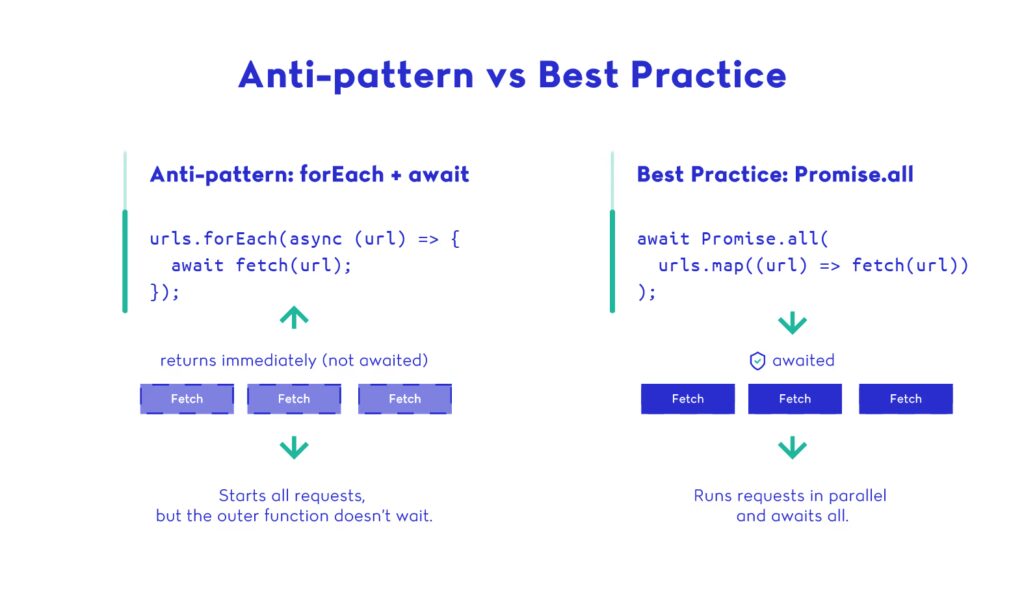
Correct Patterns for Production-Ready Code
Before we look at working examples, here’s a visual breakdown of why await in forEach fails, and how to handle async operations correctly using Promise.all.
There are two safe ways to handle async loops in enterprise JavaScript:
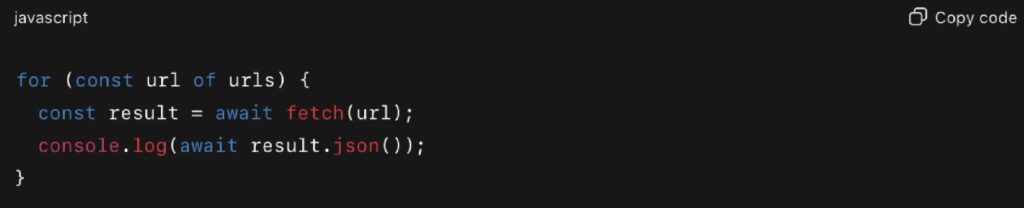
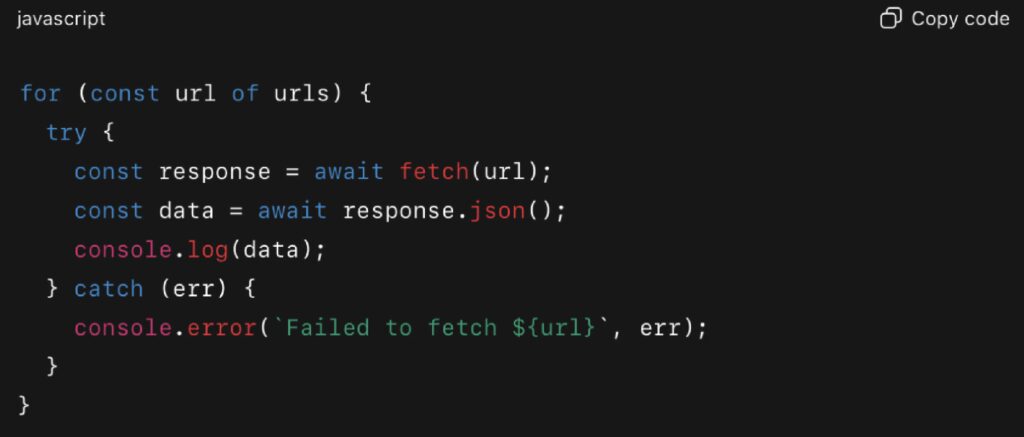
1. Sequential Execution:
Use for…of when execution order matters or when working with rate-limited APIs:
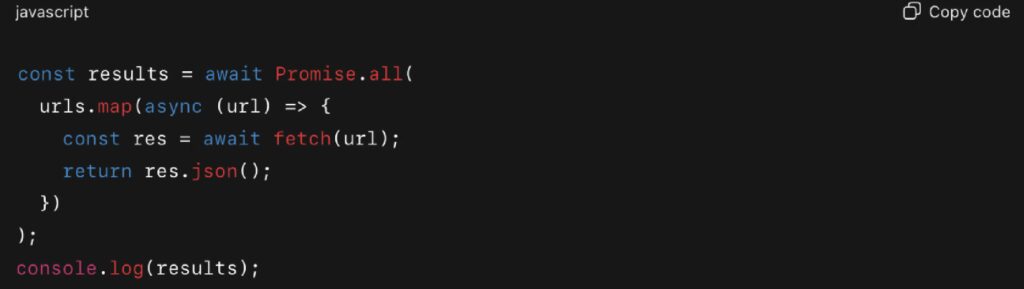
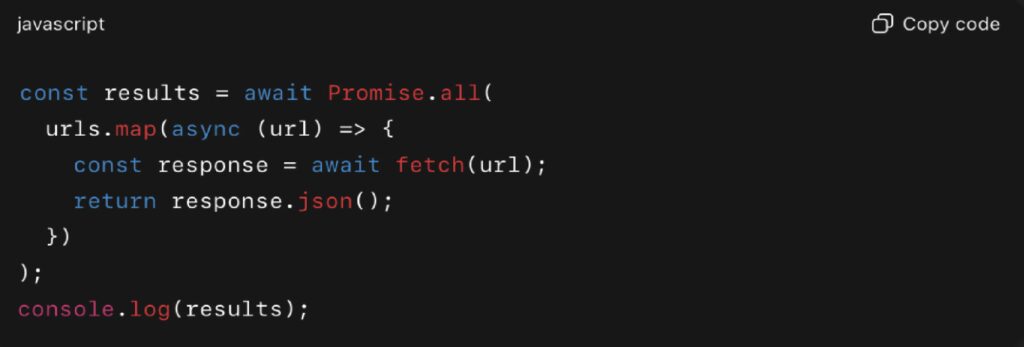
2. Parallel Execution:
Use Promise.all() to fire off requests concurrently (ideal when order doesn’t matter and performance is key):
For more granular control, Promise.allSettled() is also useful for managing partial failures.
Real-World Example: Async Loops in Node.js, 2023
In a 2023 case study shared on Mediu, a Node.js pipeline suffered severe performance degradation due to misuse of async/await. The engineering team had written a loop to forward thousands of requests to vendor services, using await inside a for…of loop. Instead of running concurrently, each request waited for the previous one to finish, causing throughput to collapse and CPU usage to surge under load.
The fix was to replace the serial loop with Promise.all() to fire requests in parallel, restoring expected performance and preventing bottlenecks. This highlights how async pitfalls can hide in plain sight until systems scale.
Tradeoffs and Team Practices
There are valid reasons to await inside loops — such as when API rate limits require it or when maintaining order is essential. But those cases should be intentional and documented, not accidental.
To avoid this class of JavaScript pitfalls:
- Never use await inside forEach
- Prefer for…of for sequential operations
- Use Promise.all for concurrent processing
- Always wrap async calls in try/catch to handle failures
- Add ESLint rules or plugins to warn against unsupported async patterns
Enterprise teams should also consider adding static analysis rules that flag unsafe async constructs during code review.
Final Notes for Enterprise Teams
The misuse of async/await in loops is one of the most subtle JavaScript pitfalls because it doesn’t crash your code — it quietly erodes your performance. These bugs often pass QA and make it to production, only to surface during performance audits or incident reviews.
In enterprise JavaScript, asynchronous control flow should be treated as architectural design, not just syntax. Teams need to decide when they want concurrency, sequencing, or retry behavior — and structure their loops accordingly. Without this discipline, async logic becomes a silent bottleneck that scales as poorly as it performs.
JavaScript Pitfall #3: Memory Leaks from Closures and Event Listeners
Memory leaks are among the most dangerous JavaScript pitfalls in enterprise applications. They don’t throw errors. They don’t crash your app immediately. But over time, they erode performance, increase load times, and introduce subtle instability — especially in long-lived single-page applications or complex UI systems.
In enterprise JavaScript, memory leaks are particularly hard to detect because they rarely break functionality during development. Instead, they cause gradual slowdowns, laggy interactions, excessive CPU usage, or even browser crashes after extended use. Most teams only discover them after customers report degraded performance — or during a painful debugging session in Chrome DevTools.
What Causes Memory Leaks in JavaScript?
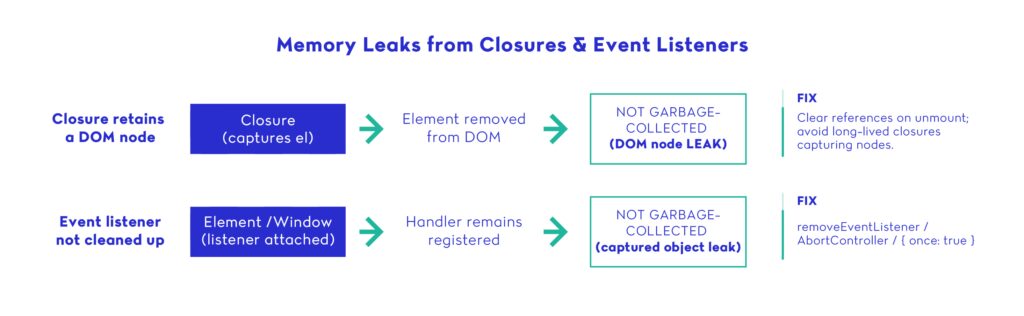
The most common sources of leaks in JavaScript include:
- Closures holding on to stale references
- Forgotten event listeners not removed on unmount
- Detached DOM nodes still referenced in memory
- Global variables unintentionally persisting large objects
- Third-party libraries with poor teardown logic
Among all JavaScript pitfalls, these are particularly insidious because they don’t behave like bugs. The app seems to “work,” but slows down as usage grows.
Let’s take a closer look at closures and listeners — the most frequent culprits in front-end memory leaks.
1. Closures Retaining Stale References
A closure is a function that “remembers” variables from its outer scope, even after that scope has finished executing. In most cases, this is a powerful feature. But in large applications, closures can unintentionally retain references to objects that should be garbage collected.
Example:
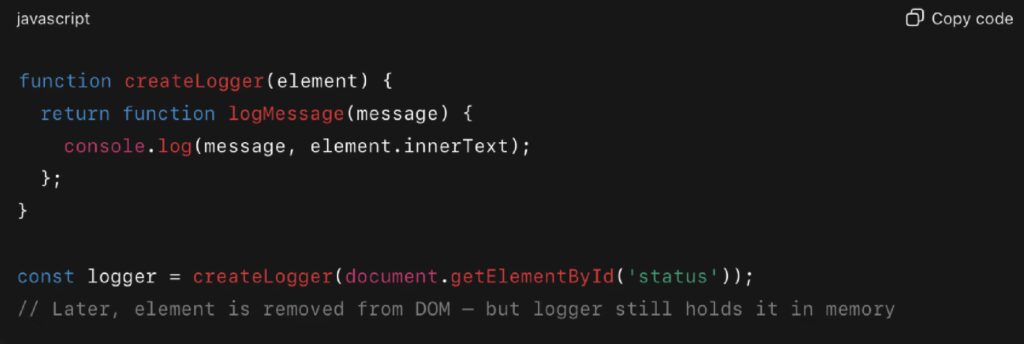
If logger is used throughout the app, the element it closes over will never be garbage collected — even if it’s no longer part of the DOM. This is one of those JavaScript pitfalls that doesn’t surface until memory starts ballooning in the background.
2. Event Listeners Not Cleaned Up
Event listeners are another common source of leaks — especially in component-based systems like React, Angular, or Vue.
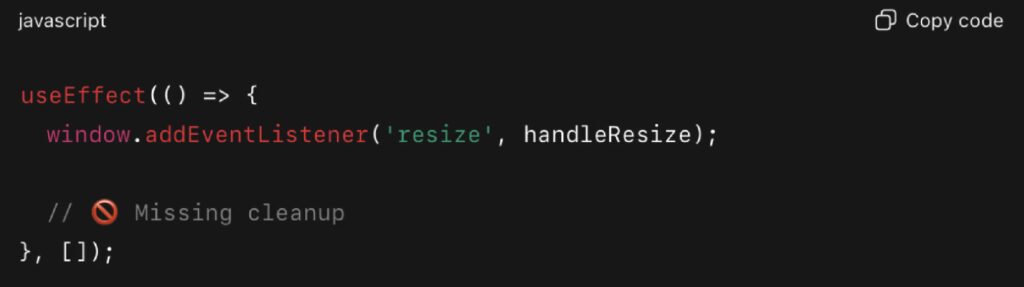
Without removing the listener on unmount, every component instance adds another reference to the same global event. Over time, this can result in hundreds of active listeners, each holding references to internal component state, DOM elements, or closures.
The fix:
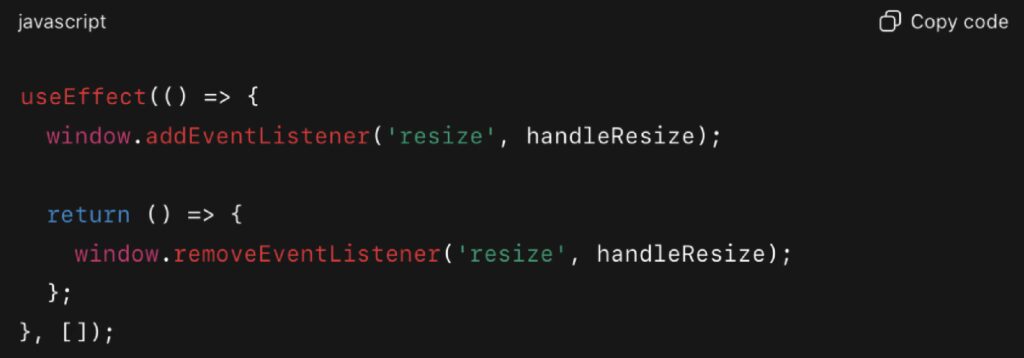
Cleaning up listeners is essential in avoiding memory-related JavaScript pitfalls in long-lived user sessions.
Why This Is Critical in Enterprise JavaScript
In large enterprise JavaScript apps, memory leaks scale with time and usage:
- SPAs with dynamic routing never “refresh,” so stale components stay in memory
- Dashboards with frequent listeners (scroll, resize, input) accumulate handlers
- High-traffic apps run for hours, multiplying the cost of each retained object
These issues slowly degrade UX: scroll lag, delayed input handling, freezing charts — or full browser crashes on low-memory devices. Among JavaScript pitfalls, memory leaks have one of the highest long-term costs.
Real-World Example: React DevTools Refresh Leak, 2024
In early 2024, an issue was reported in the React repository: repeatedly refreshing a webpage with React DevTools open caused consistent memory retention. Even when forcing garbage collection, memory usage never dropped back down, and each additional refresh increased memory overhead.
This shows how even tools maintained by the core React team can suffer from memory leaks due to state or listener retention. It’s a reminder that leaks are easy to introduce and hard to detect until load or continuous usage reveals them.
How to Detect and Prevent Memory Leaks
Enterprise teams can avoid these JavaScript pitfalls with a proactive memory management approach:
- Use Chrome DevTools’ Performance & Memory Panels
Take heap snapshots and look for detached DOM nodes or growing closures. - Use why-did-you-render or react-devtools-profiler
These tools trace unnecessary re-renders and help identify retained state. - Instrument memory usage in CI/CD
Use Puppeteer or headless tests to monitor memory profiles per page/component. - Adopt teardown patterns across the codebase
Always remove listeners, clear timers, and cancel requests on component unmount. - Avoid singletons holding references to DOM or app state
If you must use singletons, keep them stateless or prune retained objects regularly.
Final Thoughts for Enterprise Teams
Memory leaks are the kind of JavaScript pitfalls that sneak in quietly and break your app months later. In enterprise JavaScript environments — where SPAs, component lifecycles, and custom state logic dominate — leaks aren’t just possible, they’re inevitable without preventative measures.
Treat memory like a critical resource, not a background concern. Test for it. Monitor it. Add leak checks to code review guidelines. Because no matter how fast your app is today, it means nothing if it slows to a crawl after 30 minutes of use.
JavaScript Pitfall #4: Overengineered or Bloated State Management
Among the most avoidable JavaScript pitfalls in enterprise apps is overengineering state management. As applications grow in complexity, there’s a strong temptation to reach for heavyweight libraries like Redux — even when simpler options would suffice. While tools like Redux, Zustand, or Recoil serve important purposes, applying them prematurely can introduce unnecessary abstraction, slow rendering, and frustrate onboarding developers.
Why It Happens in Enterprise JavaScript
In enterprise teams, state tends to scale before product maturity. Architecture decisions are often made early, and global state solutions are introduced to handle hypothetical future use cases. Teams follow patterns from blog posts, frameworks, or legacy code without evaluating the actual state needs of their app.
This leads to a common class of JavaScript pitfalls where local UI interactions — like modals, toggles, or form inputs — end up managed in global stores, increasing the size of reducers, wiring complexity, and test surface area.
Common Symptoms of Overengineered State
- Using Redux or Zustand for trivial UI flags (e.g., modal visibility)
- Global state slices for data only used in a single component
- Mixing multiple libraries (Redux + Context + custom hooks)
- Overuse of selectors, middleware, and action types for one-off interactions
- Performance issues from deeply nested state updates triggering unnecessary re-renders
For a practical breakdown of common Redux performance pitfalls and how to avoid them, take a look at this 2023 guide on optimizing Redux applications.
Technical Breakdown: Right Tool, Wrong Job
Consider this Redux-style approach:
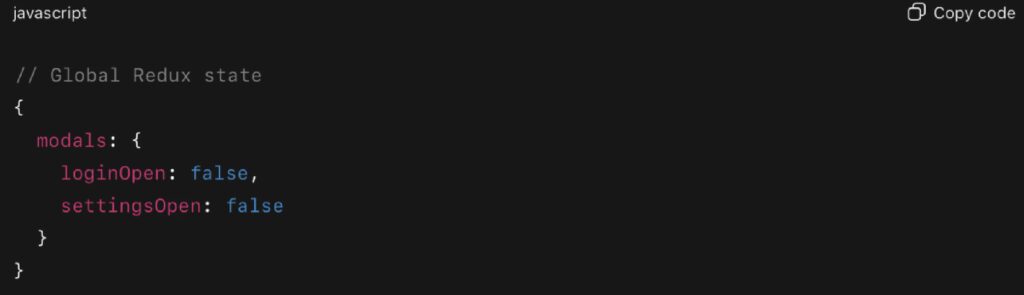
While scalable in theory, this adds boilerplate and centralizes logic for something only used within a single screen. The same functionality can be implemented locally:
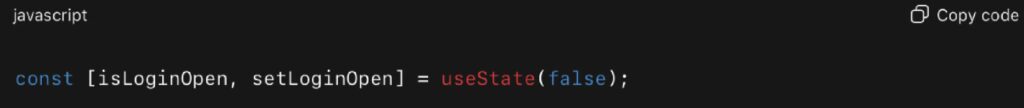
This version is faster, more readable, and avoids another javascript pitfall: state being overly abstracted from the component that owns it.
If you’d like a deeper dive into the trade-offs between local and global state management in React, check out this technical guide on scalable front-end architecture.
Real-World Example: RemNote’s Redux Refactor
In 2024, analytics from MoldStud surfaced multiple enterprise-scale applications struggling with Redux performance due to large, deeply nested global state trees and inefficient re-renders. The study showed that:
- Overuse of global state (everything in Redux) caused many react components to re-subscribe to large portions of state they didn’t need.
- Inefficient selectors and lack of memoization caused cascading renders even when only small state slices changed.
- Middleware overuse and deeply nested state increased overhead on dispatch and reduced maintainability.
By adopting these fixes, apps in the study saw measurable improvements:
- Significant reduction in unnecessary re-renders (in some cases by ~40 %)
- Flattened and normalized state shapes, leading to faster update times
- Cleaner component trees, with UI-specific state pulled to local state hooks rather than stored globally
When Global State Makes Sense
Despite the JavaScript pitfalls of overengineering, global state is still essential in enterprise apps — when used appropriately.
Use centralized state (Redux, Zustand, Jotai, etc.) for:
- Auth tokens, user settings, and persisted session data
- Shared API results accessed across modules
- Multi-page flows where state must survive navigation
- Inter-component communication across isolated features
For everything else, prefer React’s built-in tools: useState, useReducer, or scoped Context.
For a deeper dive into best practices and trade-offs, check out the official Redux performance guidance.
Best Practices to Avoid This Pitfall
To prevent one of the more common JavaScript pitfalls in growing teams:
- Start with local state and only “lift” it when necessary
- Don’t default to Redux unless sharing state across modules
- Normalize global state and isolate slices by domain
- Watch for performance regressions caused by broad state updates
- Audit your state logic as part of performance tuning
For a concise overview of practical rules to keep your state management scalable, check out this guide on avoiding improper state patterns in React.
Final Thoughts for Enterprise Teams
Overengineered state is a classic JavaScript pitfall: it sneaks in as a “best practice,” then clogs your codebase with boilerplate, poor performance, and brittle logic. In enterprise JavaScript environments, simplicity scales better than complexity — especially when working across multiple teams and modules.
The best architecture is often the least visible one. Use just enough state management to solve your current problem, and resist solving future problems until they arrive.
JavaScript Pitfall #5: Excessive Reliance on Global Variables
Among the most enduring JavaScript pitfalls in modern development is the overuse of global variables. While global scope was once a necessity in the early days of JavaScript, it has become a major liability in enterprise applications — where stability, modularity, and shared ownership are essential.
Relying on global variables in enterprise JavaScript invites silent bugs, state conflicts, and unpredictable behaviors — especially when multiple teams or vendors interact with the same codebase. What begins as a “quick config flag” often turns into a source of instability that’s hard to trace and even harder to fix at scale.
Why Global Variables Are Problematic in Enterprise JavaScript
In large-scale JavaScript systems, global state introduces three major risks:
- Namespace Collisions – When two teams or modules declare the same variable globally, one can silently overwrite the other.
- Unintended Side Effects – A global variable modified in one feature might unexpectedly affect behavior in another.
- Testing and Isolation Issues – Globals make unit testing harder by increasing shared state and causing cross-test contamination.
These JavaScript pitfalls are further magnified in enterprise apps that use dynamic module loading, plugin systems, or legacy code — scenarios where maintaining strict boundaries is already challenging.
Real-World Example: Production Outage Caused by Global State Clash
In 2023, a financial analytics company discovered a critical bug during a quarterly release. A third-party widget added to internal dashboards was assigning values to window.config — the same object used by the company’s internal build system.
When marketing introduced a new key (config.theme) through the widget, it overrode default values used in the internal app. The result? Entire sections of the UI failed to render for thousands of users.
This JavaScript pitfall — assuming that global scope is isolated — led to lost productivity, internal escalation, and rollback of a key feature.
Common Patterns That Lead to Global Variable Abuse
These patterns are easy to introduce — and harder to catch in reviews or tests:
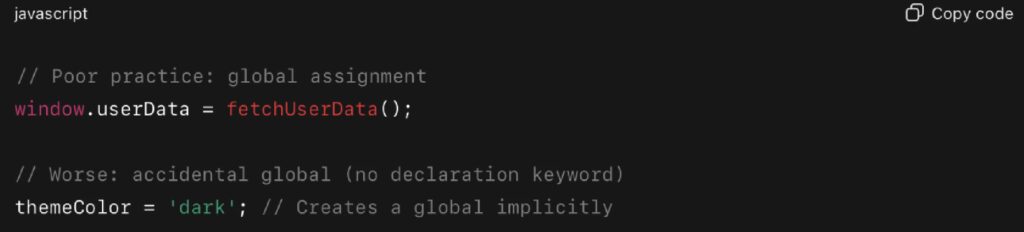
Additional red flags:
- Assigning directly to window or globalThis
- Declaring variables outside of any module
- Polyfilling global objects without checks
- Sharing feature flags or config across unrelated teams using global scope
These JavaScript pitfalls often originate in legacy systems or fast-moving vendor integrations.
Best Practices to Avoid Global State Issues
To avoid the fragility that global variables introduce:
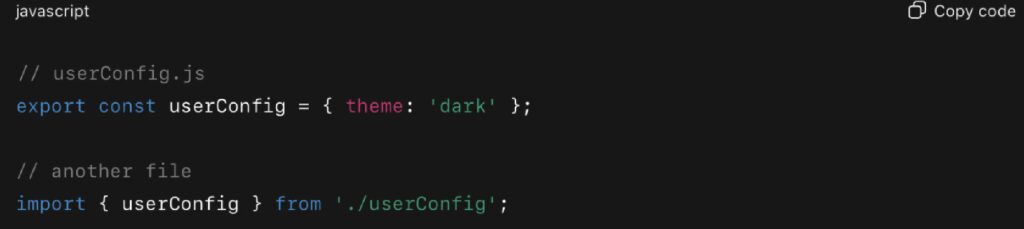
- Use Modules with Explicit Imports and Exports
Encapsulate state in dedicated files.
- Use Scoped Configuration, Not window.config
In React and similar frameworks, pass configuration via props or context—never global objects.
- Avoid Leaking State to window
If interaction with global scope is necessary (e.g. analytics, SDKs), isolate it into a single utility or adapter.
- Use ESLint Rules to Detect Unsafe Patterns
Enable rules like no-undef, no-global-assign, and no-restricted-globals to flag risky usage before it ships.
- Document Any Necessary Globals
If a global variable is injected by a backend system (e.g. window.__INITIAL_STATE__), declare it in a types file (global.d.ts) and document it for other teams.
These steps reduce the risk of unintentional side effects — one of the most frustrating JavaScript pitfalls in shared enterprise environments.
Enterprise Context: Why This Pitfall Persists
Despite widespread awareness, global variables persist in enterprise JavaScript for several reasons:
- Legacy migration: Monoliths broken into micro frontends still share the same global runtime.
- Third-party tools: Vendors inject code into window to expose APIs or default behaviors.
- Shared integrations: Internal scripts, analytics trackers, or SDKs depend on mutable global config.
Examples include:
- A vendor modifying window.dataLayer without resetting it properly
- A legacy codebase using window.flags to control UI across multiple modules
- A third-party tool overwriting window.renderWidget, breaking a custom internal component
These hidden dependencies are difficult to track, and once introduced, can take months to fully decouple.
Further Reading and Resources
If you’d like to explore this topic in more depth, here are some excellent guides:
- Learn the fundamentals of JavaScript global variables and their pitfalls in this MDN reference.
- Deepen your understanding of scope and closures with Kyle Simpson’s You Don’t Know JS.
- Get a modern overview of risks and best practices in this 2024 guide to global variables in JavaScript.
Final Thoughts for Enterprise Teams
Among the many JavaScript pitfalls that undermine code quality, global variable misuse is one of the oldest — and most persistent. It bypasses architectural guardrails, introduces state conflicts, and creates side effects that are nearly impossible to trace in large codebases.
In enterprise JavaScript, treat global variables like radioactive material: use only when necessary, isolate their impact, and document their presence rigorously. In most cases, modular architecture and scoped logic will serve you better — and scale more safely.
JavaScript Pitfall #6: Weak Error Handling in Asynchronous Code
In large-scale systems, asynchronous logic is everywhere — data fetching, file operations, user interactions, third-party integrations. Yet one of the most damaging JavaScript pitfalls in modern applications is weak or nonexistent error handling in this async logic.
In enterprise JavaScript apps, where uptime, observability, and team coordination are critical, unhandled promise rejections and silent async failures can cause UI breakage, data loss, or degraded user experiences. Unlike synchronous errors, async failures often escape notice during development and testing — and only show up in production logs or user complaints.
Why Async Error Handling Is a JavaScript Pitfall
Developers often assume that wrapping an async function in a try/catch is enough — but real-world async logic is more complex. Consider these common scenarios:
- Using Promise.all() without handling individual failures
- Forgetting .catch() on chained promises
- Missing global rejection handlers
- Throwing inside async callbacks passed to third-party code
- Not adding retry logic for flaky APIs
These issues rarely cause visible errors. Instead, they silently fail — returning undefined data, skipping execution, or breaking interdependent flows. It’s one of those JavaScript pitfalls that makes a system “seem” fine — until it starts corrupting data or failing in ways that are hard to trace.
Real Example: Async Error Causing Production Crash
In July 2025, a JavaScript-in-Plain-English article detailed a case where unhandled promise rejections caused a complete Node.js process crash in production due to missing error handlers in asynchronous code.
The post explains how even a single unhandled rejection can terminate the process unexpectedly and offers patterns to prevent such failures in enterprise-grade environments.
Why This Matters in Enterprise Context
This is exactly the kind of JavaScript pitfall that strikes hardest in large systems: brittle async flows disappearing in production, where missing .catch() or try/catch logic ends up crashing servers or breaking user-facing pipelines.
Example: What Developers Commonly Miss
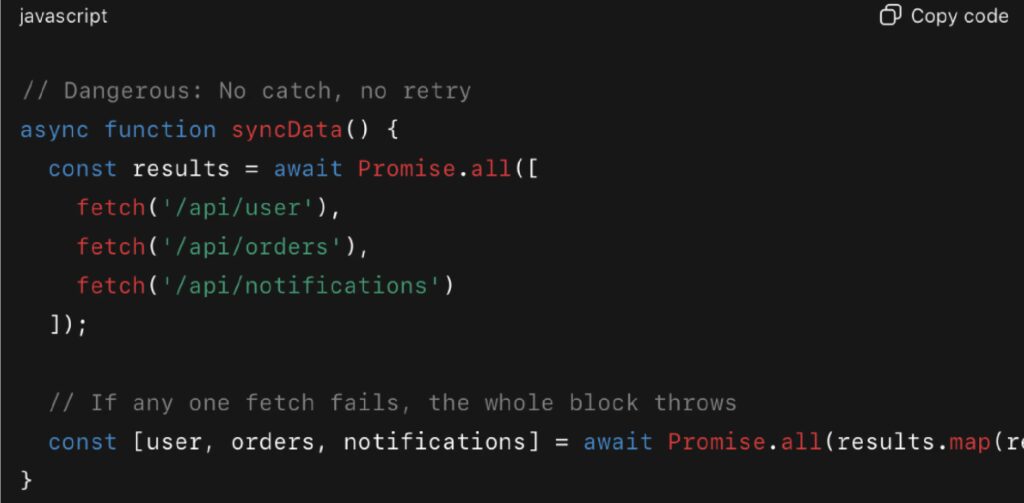
Better: Safe and resilient
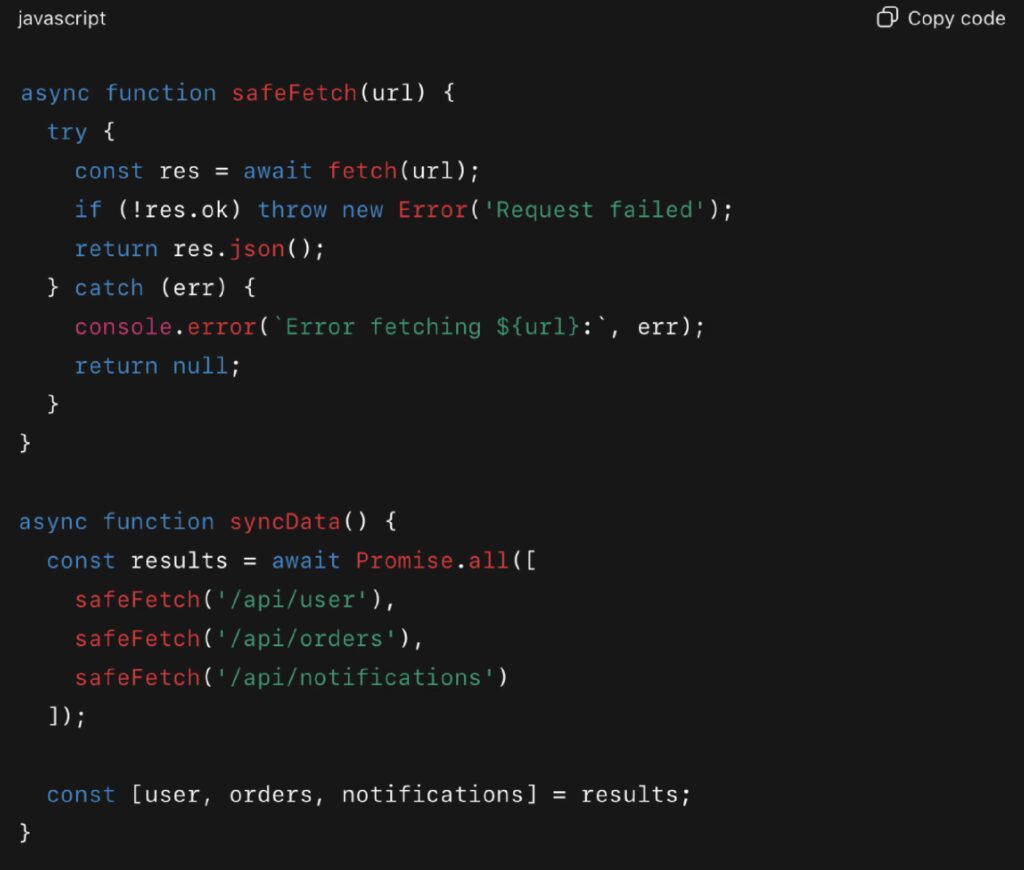
Best Practices to Avoid This Pitfall
This is one of the more dangerous JavaScript pitfalls because async logic tends to be abstracted into helpers, hooks, or services — where weak error handling can propagate silently through the entire application.
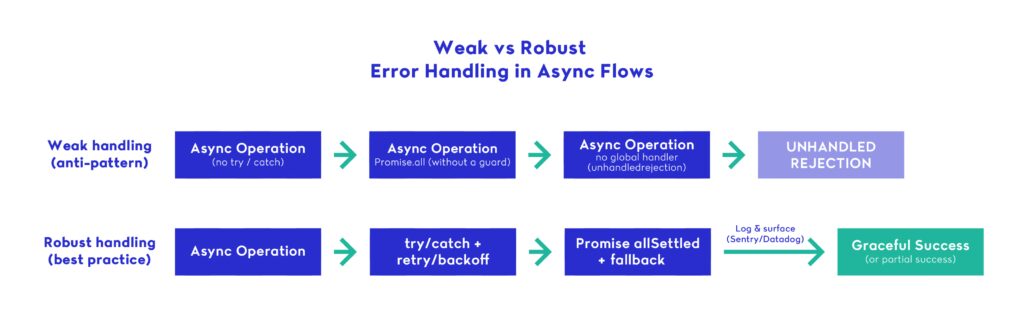
To avoid async failure traps:
- Always use try/catch blocks in async functions
- Wrap Promise.all() with fallback logic or use Promise.allSettled()
- Implement global error boundaries or logging systems
- Add retry/backoff logic for network calls
- Use monitoring tools like Sentry, Datadog, or LogRocket to surface async failures
Framework-Specific Strategies
In React:
- Use error boundaries for component trees
- Use useEffect with try/catch and cleanup
- Don’t ignore async errors in event handlers or loaders
In Node.js:
- Handle unhandledRejection globally
- Use libraries like p-retry or axios-retry for automatic backoff
- Validate all input/output inside async middleware (especially in Express)
In Next.js (2025):
- Use try/catch in server actions and route handlers
- Handle fetch errors on the server and return sanitized errors to the client
- Watch for failed deployments or stale caches due to failed edge logic
Recommended Reading
For more practical insights into avoiding async pitfalls at scale, these resources are worth exploring:
- Discover strategies for writing cleaner, more resilient async code in Node.js Async Best Practices & Avoiding Callback Hell (RisingStack / CloudBees, 2024).
- Learn how to prevent silent failures and handle async/await properly in Error Handling with Async Await in JavaScript Applications (Codefinity, 2024).
- Explore safer concurrency patterns with How to Use Promise.allSettled() in JavaScript (FreeCodeCamp).
Final Thoughts for Enterprise Teams
Weak async error handling is one of the most underestimated JavaScript pitfalls in production systems. In enterprise JavaScript, the stakes are higher: API failures impact entire workflows, unhandled rejections skew data reporting, and silent failures damage user trust.
As systems grow more asynchronous — with distributed APIs, real-time updates, and background jobs — robust error handling becomes architecture, not just syntax. Build your async code like you expect it to fail — because in production, eventually, it will.
JavaScript Pitfall #7: Lack of Code Splitting or Lazy Loading
In 2025, users expect web apps to load in under two seconds — regardless of complexity. But many modern frontend applications still ship massive JavaScript bundles on initial load. This makes lack of code splitting or lazy loading one of the most critical and performance-impacting JavaScript pitfalls in enterprise environments.
When a single JavaScript bundle contains code for every route, feature, and component — even those not immediately needed — it delays the time to first render, frustrates users, and hurts Core Web Vitals scores. In enterprise JavaScript systems where performance must scale across teams and devices, skipping code splitting is no longer a minor oversight — it’s a fundamental architectural problem.
Why It’s One of the Most Costly JavaScript Pitfalls
Many teams avoid code splitting due to time pressure or misconceptions about complexity. Others assume that bundlers like Webpack, Vite, or Next.js handle everything automatically. But while modern build tools enable code splitting, they don’t enforce it. Without intentional use of import() and dynamic loading, even the best-configured toolchain will deliver a monolithic bundle.
The result? Your app may be shipping 100+ KB of unused JavaScript on every page load — causing longer initial load times, slow interactions on low-powered devices, and poor Lighthouse scores.
These kinds of oversights are classic JavaScript pitfalls: seemingly small issues that quietly snowball into major performance bottlenecks at scale.
Real-World Example: Next.js 13 + RSC Cuts JS & Lifts Scores (GeekyAnts, 2024)
In 2024, GeekyAnts migrated to Next.js 13 with React Server Components and added dynamic imports for heavy UI pieces (e.g., syntax highlighter). By sending less client-side JS and loading non-critical code on demand, they report 90+ Lighthouse scores post-deployment and show before/after charts of reduced JS execution work. While not exposing TTI specifically, the case demonstrates how deferring JS and splitting payloads improves real-world responsiveness.
What Code Splitting and Lazy Loading Actually Do
Code splitting is the process of breaking your JavaScript bundle into smaller chunks, so that only the necessary code is loaded initially.
Lazy loading refers to deferring the loading of components or modules until they are actually needed — typically based on user navigation or interaction.
These practices:
- Reduce initial page load size
- Speed up Time to First Paint (TTFP) and Time to Interactive (TTI)
- Improve Lighthouse and Web Vitals scores
- Reduce memory consumption, especially on mobile devices
In large apps, skipping these optimizations is one of the most measurable JavaScript pitfalls — and one of the easiest to fix with the right setup.
Code Example: Dynamic Import for Route-Based Code Splitting
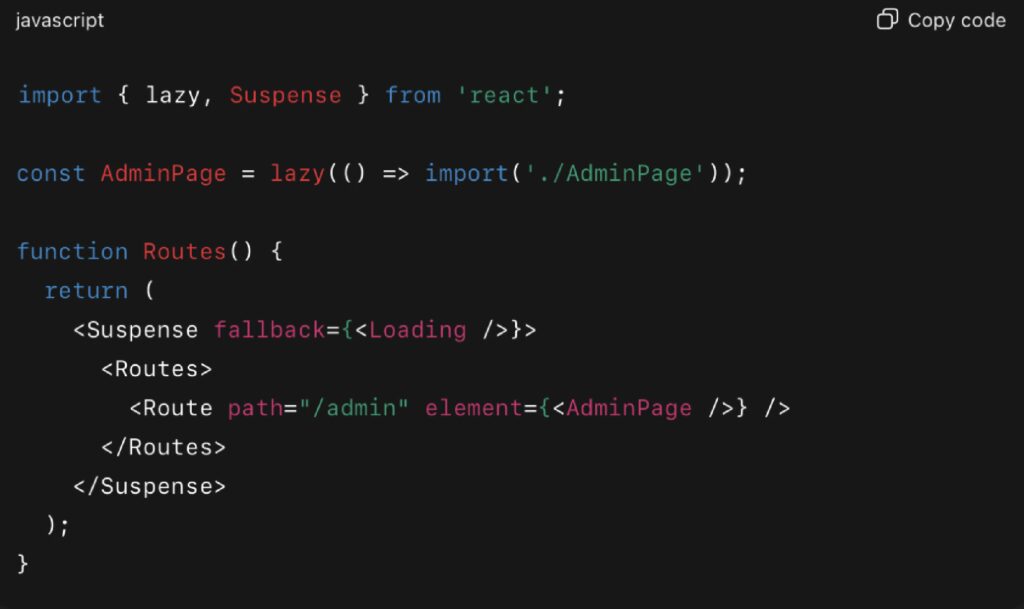
This pattern ensures that the /admin route is only loaded when the user navigates to it — removing hundreds of KB from the initial payload.
Why Enterprise JavaScript Projects Often Miss This
In enterprise JavaScript, teams often:
- Work on modular features in isolation, unaware of total bundle impact
- Reuse shared layouts or wrapper components that import everything by default
- Postpone performance improvements to “later” sprints that never come
- Assume their framework handles splitting automatically (Next.js, Nuxt, Angular, etc.)
But ignoring bundle weight is one of the more expensive JavaScript pitfalls long-term — it degrades every user session, increases infrastructure costs, and worsens SEO.
Framework-Specific Tools and Techniques
- React: React.lazy, Suspense, Loadable Components, React Router lazy()
- Next.js: Dynamic imports via next/dynamic, automatic route-based splitting
- Vue 3: defineAsyncComponent, dynamic import inside routes
- Angular: Lazy-loaded modules with the Angular CLI and route configuration
- Webpack/Vite: Split via import() and chunk naming
Each of these tools helps avoid one of the most measurable JavaScript pitfalls in production.
Tips for Avoiding This Pitfall
- Audit your bundles with tools like webpack-bundle-analyzer or source-map-explorer
- Use dynamic imports for routes, features, and third-party libraries
- Isolate heavy modules like charts, editors, or maps into async chunks
- Measure bundle size impact per feature during pull requests
- Monitor Core Web Vitals over time — not just during development
Further Reading & References
- To go deeper on code-splitting and payload reduction, start with Chrome’s overview and patterns in “Reduce JavaScript payloads with code splitting”.
- For framework-specific guidance, see the official React docs on code-splitting and how to apply React.lazy/Suspense.
- If you want a step-by-step course on splitting initial vs. deferred code, read the Web.dev Learn guide “Code-split JavaScript” (Dec 2023).
- For a developer perspective with practical tips and examples, check out this Medium write-up: “Reduce JavaScript payloads with code splitting — a developer’s guide to faster websites” (Mar 2025).
- And for React-specific patterns, dive into Web.dev’s article on code-splitting with React.lazy and Suspense.
Final Thoughts for Enterprise Teams
This is one of the most visible yet fixable JavaScript pitfalls in production apps. Poor code splitting isn’t just a performance issue — it’s a scalability issue. Every kilobyte of unnecessary JavaScript affects mobile users, slows down onboarding, and increases support costs.
In enterprise JavaScript, code splitting and lazy loading aren’t just nice-to-haves — they’re architectural requirements. Prioritize them early, enforce them in code reviews, and build them into your CI/CD pipeline.
When it comes to performance, what you don’t ship matters more than what you do.
JavaScript Pitfalls Aren’t Bugs — They’re Architecture Warnings
As this guide has shown, the most dangerous JavaScript pitfalls rarely show up as red flags during development. Instead, they appear months later in production as performance drops, broken UIs, or unstable features. In many enterprise JavaScript projects, these issues become accepted as “just how the app works” — until a serious outage or user complaint forces action.
But these are not unavoidable problems. They are preventable architectural oversights, and avoiding them is what separates reactive teams from resilient ones. Partnering with the right companies that know how to help you prevent these pitfalls is the best way to guarantee success. Reach out to us so we can analyze the best ways to help.
Key Takeaways to prevent JavaScript Pitfalls
- Global variables? Still one of the most persistent JavaScript pitfalls
- Async logic without try/catch? A silent failure waiting to scale
- Memory leaks from listeners and closures? Hard to debug and harder to trace
- State overengineering? Slows teams, bloats bundles
- No code splitting? Performance suffers on every page load
Each of these issues represents not just technical debt, but a breakdown in how teams design and maintain enterprise JavaScript systems.
Why Avoiding JavaScript Pitfalls Must Be Intentional
The reality is this: JavaScript pitfalls don’t disappear with better tooling alone. They require intentional decisions — strict linters, pattern reviews, architectural discipline, and a shared team mindset. Without that, the same problems will show up again in every new module or product release.
To build scalable, maintainable, and performant apps, treat JavaScript pitfalls as red flags for deeper system problems — not just code-level bugs.