In 2026 mastering javascript performance optimization is essential for developers building modern web applications. Users expect pages to load instantly and respond without delay, and businesses that fail to prioritize performance risk losing customers to faster competitors. Effective javascript performance optimization goes beyond shaving milliseconds from load times; it is a fundamental discipline that impacts search rankings, user retention, runtime efficiency, and overall experience.
The rise of single page applications, real-time interfaces, and increasingly dynamic features means that traditional approaches to speed are no longer enough. Javascript performance optimization now requires a holistic view of code delivery, runtime behavior, resource loading, and tooling. Developers must measure performance meticulously with modern metrics and adjust both how code is written and how it is served. Thoughtful javascript performance optimization can transform a sluggish interface into a responsive experience that feels native.
Real-world examples of javascript performance optimization are already visible in community discussions about modern APIs and patterns. For example, examining the top 10 underrated javascript APIs in 2025 reveals opportunities to reduce code complexity and improve efficiency by using built-in browser capabilities instead of heavy libraries. These APIs can support more performant code paths when applied in the right context.
In this guide you will learn how to approach javascript performance optimization methodically. You will discover how to measure key performance indicators, optimize critical scripts, profile runtime behavior, streamline bundling, and apply caching strategies. By the end of this article you will understand not only best practices but also how to implement them with real tools and techniques in 2026.
This checklist provides a concise overview of the core actions developers should apply when focusing on javascript performance optimization. Each step reflects practices aligned with 2026 performance standards and real measurement techniques used across modern web platforms. The goal is to offer a reference that supports predictable outcomes when you apply javascript performance optimization during planning, development, and auditing.
- Measure performance using field data from metrics such as Largest Contentful Paint, Total Blocking Time, and Interaction to Next Paint. These indicators guide javascript performance optimization by revealing real user bottlenecks rather than assumed issues.
- Reduce the amount of code shipped by auditing unused modules and applying code splitting, ensuring that javascript performance optimization begins with smaller bundles and lighter delivery paths.
- Prioritize critical scripts by deferring nonessential logic and loading only what is required for initial rendering, allowing javascript performance optimization to influence how quickly key content appears.
- Profile runtime behavior using tools like the Chrome DevTools Performance panel to capture CPU usage, memory patterns, and long tasks, enabling targeted javascript performance optimization based on measurable patterns.
- Minify and compress assets through modern build tools to reduce parse and execution times, ensuring that javascript performance optimization affects both network transfer and browser processing.
- Apply caching strategies such as efficient Cache-Control headers and service worker caching to retain frequently used assets, extending javascript performance optimization beyond the code itself.
- Assess the architecture of your code by identifying patterns that scale and prevent unnecessary work, incorporating insights such as those found in posts exploring javascript patterns that improve code quality at scale.
- Continuously test and validate improvements to confirm that each technique contributes meaningfully to overall javascript performance optimization.
Understand and Measure Performance First
Why Measurement Matters Before Any Optimization
A disciplined approach to javascript performance optimization starts with knowing what is truly slowing the application. Many teams introduce changes based on intuition rather than data, which leads to unpredictable results. Meaningful improvements require measurable evidence about how users experience the application in real conditions.
Key Metrics That Guide Performance Work
Metrics such as Largest Contentful Paint, Total Blocking Time, and Interaction to Next Paint reveal the sources of delay during rendering and responsiveness. These indicators help determine whether poor javascript performance optimization results from heavy scripts, excessive computation, or inefficient loading patterns. When these metrics are tracked consistently, they provide a baseline for evaluating both regressions and improvements.
Tools That Expose Runtime and Loading Bottlenecks
Chrome DevTools, Lighthouse, and WebPageTest allow developers to capture timelines, CPU usage, long tasks, and memory behavior. These tools give direct insight into where javascript performance optimization efforts should focus. For example, examining a detailed performance trace on WebPageTest can highlight slow JavaScript modules or blocking operations that delay interactivity.
The Difference Between Lab Data and Field Data
Lab data from controlled environments helps isolate specific issues, but field data shows how the application behaves on real devices and real connections. Effective javascript performance optimization requires balancing both perspectives. Improvements that look successful in the lab may not produce meaningful gains for users with slower hardware or constrained networks.
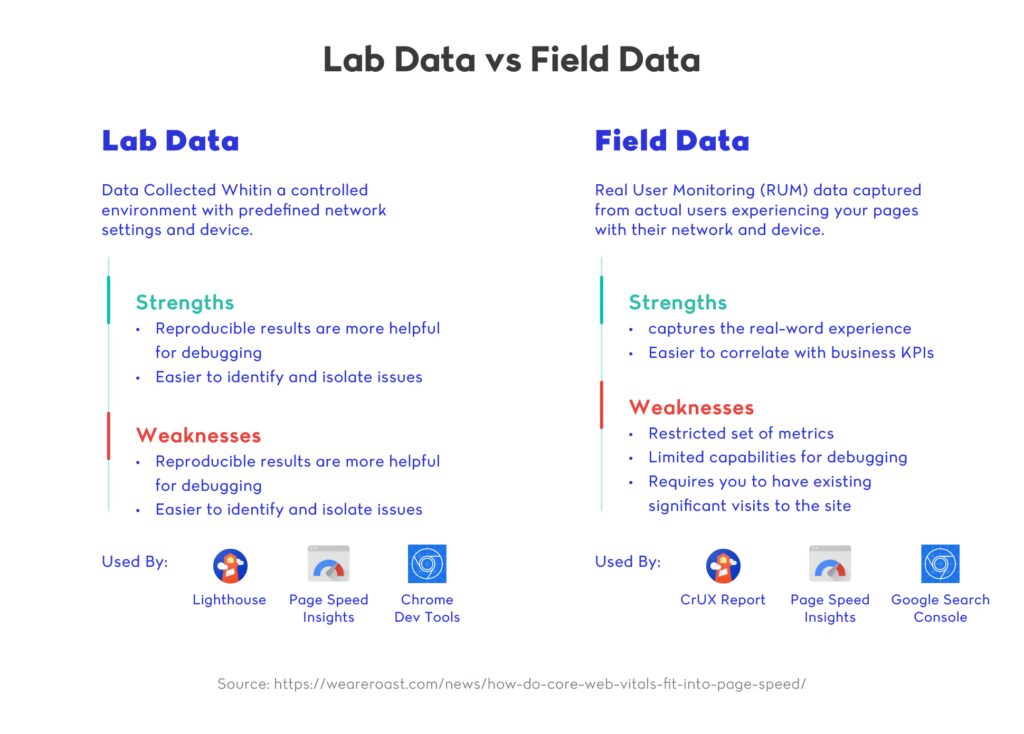
A practical approach is to treat lab data as the starting point for controlled experiments and field data as the validation layer that confirms whether changes genuinely improve user experience. Lab environments help isolate specific performance issues during javascript performance optimization, while field environments reveal how those improvements behave under real-world constraints such as slow devices, congested networks, or unpredictable interaction patterns. When combined, both perspectives give developers the confidence that their javascript performance optimization efforts are not only technically sound but also meaningful for actual users.
Identifying Early Bottlenecks in Code and Build Pipelines
During audits, developers often uncover inefficiencies in bundling, unused modules, or patterns that create unnecessary runtime work. Reviewing resources such as our post on Javascript Bundlers and Transpiliers, exposes how build systems might inflate bundle size or introduce redundant transformations. Understanding these early-stage bottlenecks supports javascript performance optimization before code even reaches production.
Establishing a Baseline for Ongoing Optimization
Every subsequent technique relies on a clear baseline. Without accurate measurement, optimization becomes guesswork and cannot be validated. A consistent tracking strategy ensures that each change meaningfully contributes to overall javascript performance optimization and prevents regressions over time.
Optimize Critical JavaScript and Prioritize Loading
Why Critical JavaScript Matters for Perceived Speed
When users load a page, only a small portion of the code is necessary to display and interact with the initial view. Prioritizing this code is essential for effective javascript performance optimization because it directly influences how quickly content becomes usable. If non-essential scripts block rendering, even small delays affect perceived responsiveness. Treating critical JavaScript as a first-class concern ensures that the browser spends its earliest cycles doing work that contributes to what the user sees.
Techniques for Identifying Critical and Non-Critical Code
A structured audit helps distinguish which modules, functions, or components are required during the first render. This allows developers to sequence execution more intentionally during javascript performance optimization. Tools such as Chrome DevTools Coverage or the React Profiler can highlight unused code paths, revealing where lazy loading or deferral would simplify the critical path. This step ensures that only the essential layers remain part of the immediate loading workflow.
Using Modern Loading Strategies to Reduce Blocking
Modern bundlers and frameworks support techniques like dynamic imports, route-based code splitting, and hydration boundaries. These strategies reduce the amount of work the browser must perform upfront. Applying them correctly supports javascript performance optimization by lowering parse tim e, reducing blocking tasks, and distributing work more evenly across the lifecycle of the application. Developers adopting these approaches often see faster time-to-interactive on mobile devices and constrained networks.

A more advanced layer of these techniques involves aligning loading strategy with user intent and route structure. Scripts that support content above the fold should be delivered with high priority, while scripts tied to less immediate functionality should be deferred until interaction occurs. Modern browsers increasingly optimize around these signals, but developers still need to define when a script should execute to avoid unnecessary competition for main-thread time. When applied thoughtfully, these decisions create a predictable startup profile and strengthen javascript performance optimization by ensuring the browser performs the right work at the right moment.
Real Example of Code Splitting in Practice
A practical example can be found by reviewing modern guidance from vitejs.dev, which demonstrates how route-level code splitting reduces bundle size and improves responsiveness. By adopting similar patterns, teams can remove nonessential logic from the initial load, improving javascript performance optimization without altering business logic. This approach allows large applications to preserve feature breadth while improving startup performance.
Tradeoffs and Considerations When Reducing Critical JavaScript
Although minimizing initial script execution is essential, aggressive splitting introduces additional network requests. Under HTTP and HTTP/2 this was a limitation, but HTTP/3 mitigates some of the overhead through reduced latency. Balancing these factors is part of disciplined javascript performance optimization. The focus is to reduce blocking work without creating unnecessary fragmentation that slows execution later in the user journey.
Incorporating Enterprise-Scale Patterns
Large applications benefit from patterns that prevent repeated work across modules. Reviewing insights on javascript patterns that improve code offers perspective on architectural decisions that support predictable loading behavior. This type of structural thinking elevates javascript performance optimization beyond task-level tuning and into system-level planning.
Ensuring Prioritized Loading Across the Entire Lifecycle
Effective prioritization extends past the initial render. As the application grows, new features, routes, and integrations can inadvertently add blocking scripts. A continuous review of loading order ensures that javascript performance optimization remains consistent across updates. Teams that maintain this discipline create user experiences that load quickly regardless of scale.
Performance Profiling and Runtime Optimization
Why Runtime Profiling Matters
Even when loading is optimized, many performance issues emerge only after the application begins executing. Profiling the runtime environment allows developers to see how the browser handles CPU work, memory allocation, and long tasks during actual use. This stage is essential for javascript performance optimization because it exposes inefficiencies that cannot be detected through static analysis or bundle inspection. Without runtime insights, teams risk addressing only superficial bottlenecks while deeper issues persist.
Tools for Capturing Real Execution Data
Modern profiling tools such as Chrome DevTools, Firefox Performance Panel, and Node.js Inspector reveal how functions behave under real conditions. These tools highlight call stacks, execution duration, and memory consumption, which are central to systematic javascript performance optimization. Developers can identify heavy loops, expensive re-renders, or recursive logic that grows with application state. Each insight allows teams to refine code paths that affect responsiveness and interaction quality.
Understanding CPU Work, Long Tasks, and Event Loops
Long tasks are a major source of visible lag, and profiling helps isolate when the main thread becomes busy for extended periods. By inspecting task duration and root causes, developers can break expensive operations into smaller units or shift them off the main thread. These adjustments contribute directly to javascript performance optimization by ensuring responsive interactions. Understanding how the event loop schedules work also helps developers prioritize asynchronous patterns that prevent blocking and keep the interface fluid.

A deeper understanding of these mechanisms also helps developers interpret profiling results more accurately. When you can distinguish between time spent on scripting, rendering, and idle periods, it becomes easier to map performance traces to the underlying behavior of the application. This clarity improves decision-making during javascript performance optimization because it reveals whether a slowdown is caused by computational complexity, layout recalculations, or queued callbacks waiting for main-thread availability. With a complete picture of how work flows through the runtime, improvements become more targeted and more reliable.
Practical Example of Runtime Profiling
A practical reference point can be found in the profiling guidance published at react.dev, which demonstrates how to analyze component rendering behavior using the React Profiler. This resource shows how wasted renders and unnecessary state updates can accumulate into measurable slowdown. When applied to broader applications, the same principles support javascript performance optimization by revealing where runtime cost increases with scale or user activity.
Memory Profiling and Understanding Growth Over Time
Memory leaks and uncontrolled allocation can degrade performance steadily as a session progresses. Profiling memory snapshots shows which objects persist longer than intended and which components fail to release resources. Addressing memory issues is an important part of javascript performance optimization because leaks often go unnoticed until a page feels slow or unstable. Regular reviews of memory usage ensure that the application remains performant under prolonged or repeated use.
Tradeoffs and Limitations of Profiling
Profiling is powerful but must be interpreted carefully. Running profiles can affect execution timing, and synthetic scenarios may not reflect typical usage. Developers must combine controlled profiling sessions with real-world observations to make improvements that generalize. This balanced approach ensures that javascript performance optimization is based on accurate evidence rather than misleading traces or artificial benchmarks.
Building a Culture of Continuous Runtime Evaluation
As applications grow, new dependencies, features, and integrations can introduce fresh runtime complexity. Regular profiling cycles help detect emerging issues before they reach production. Teams that adopt a culture of ongoing runtime evaluation strengthen their overall approach to javascript performance optimization and maintain high responsiveness throughout the life of the product.
Bundling, Minification, and Code Transformations
Why Bundling Still Matters in 2026
Bundling continues to be an essential step in reducing network overhead, especially for applications with large dependency trees. When applied strategically, bundling strengthens javascript performance optimization by controlling how scripts are grouped and delivered. Even with the growing support for native ESM in browsers, bundling remains an important strategy for generating predictable builds and reducing startup time.
Tree Shaking, Dead Code Removal, and Module Scoping
Modern bundlers aggressively remove unused exports, dead branches, and unnecessary modules. These transformations contribute to javascript performance optimization by lowering execution cost and preventing redundant code from being shipped to the client. Module scoping further enhances clarity and reduces the work the JavaScript engine must perform during evaluation.
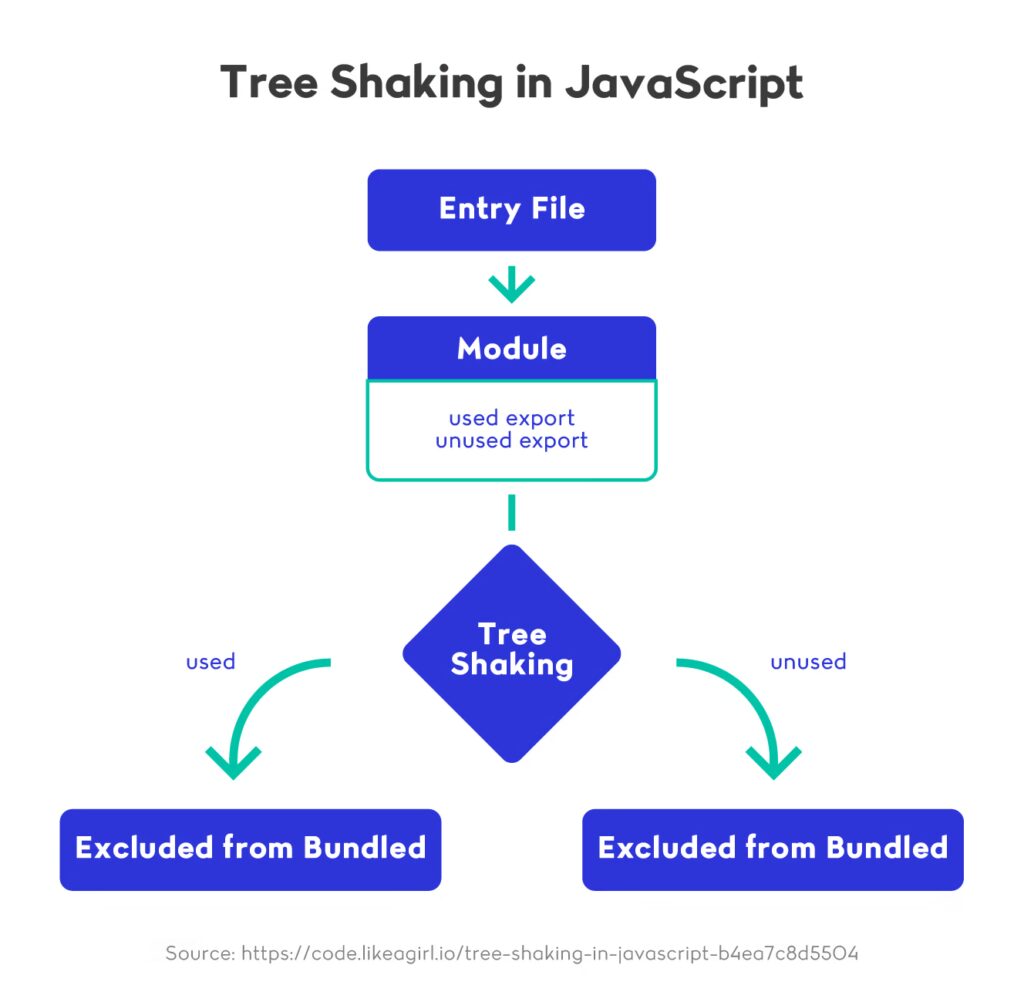
Tree shaking becomes even more effective when paired with clear module boundaries and predictable export patterns. Libraries that expose narrowly scoped functions or components allow bundlers to analyze usage with higher accuracy, reducing the chances of accidental inclusion of large internal utilities. This reinforces javascript performance optimization by ensuring that the bundle reflects only the code paths the application genuinely depends on. When developers adopt consistent modular structures, bundlers can reliably remove unused branches, producing smaller, more focused builds that load and execute more efficiently.
Minification and Compression Strategies
Minification tools rewrite code into smaller, more compact forms, while compression formats like Brotli and Gzip reduce payload size during transfer. These processes are integral to javascript performance optimization because they shorten both download and parsing time. The result is a more efficient path to interactive content, particularly important on mobile networks and global applications.
Practical Example from a Modern Build System
A helpful reference for contemporary build workflows can be found at esbuild.github.io, which details how high-speed transformation pipelines reduce build times while producing tightly optimized output. This example illustrates how modern tooling approaches bundling and minification at scale, giving developers tangible guidance for planning javascript performance optimization across large projects with complex dependency graphs.
Considering Build Complexity and Developer Experience
As bundlers incorporate more capabilities through plugins and optimization layers, complexity can increase. While advanced pipelines offer deeper control, they also require maintenance and thoughtful configuration. Teams must determine whether each enhancement provides measurable improvements to javascript performance optimization or whether a simpler structure would yield comparable results with lower operational cost.
Matching Transformations to Application Scale
Transformation strategies must reflect the real scope of the application. Smaller applications may benefit from minimal bundling and straightforward minification, while enterprise-level systems depend on layered optimization techniques. Ensuring that the chosen transformations align with project scale prevents over-engineering while still supporting javascript performance optimization at the level required for long-term growth.
Ensuring Ongoing Bundle Evaluation
Even well-designed bundles expand over time as new features and dependencies are introduced. Routine analysis using bundle visualization tools helps teams understand size changes, unused modules, and potential regression points. This practice supports javascript performance optimization by ensuring that bundles remain efficient, maintainable, and aligned with evolving performance requirements.
Caching Strategies for JavaScript
Why Caching Matters for Long-Term Performance
Caching is one of the most effective ways to reduce repeated network requests and improve load time stability across sessions. When implemented well, caching supports javascript performance optimization by ensuring that frequently used assets do not need to be downloaded on every visit. This reduces bandwidth consumption, shortens startup time, and creates smoother user experiences, especially on slower or metered networks.
Leveraging HTTP Cache-Control for Predictable Delivery
HTTP caching headers such as Cache-Control, ETag, and Last-Modified allow browsers to store responses and reuse them efficiently. These directives are central to javascript performance optimization because they govern how long a file remains available without requiring a round-trip to the server. By combining versioned file names with appropriate caching rules, developers can serve long-lived assets while maintaining control over updates. This approach ensures consistent performance without risking stale application logic.
Using Service Workers to Persist Critical Assets
Service workers extend caching capabilities beyond basic HTTP rules by enabling developers to intercept network requests programmatically. They can store application shells, route files, or even precomputed responses, providing offline support and faster load times. This functionality strengthens javascript performance optimization by allowing the browser to access essential assets immediately, even before the network connection is fully available. Service workers also give developers the flexibility to apply different caching strategies to different asset types.
Real Example from Modern Web Fundamentals
A practical reference for implementing controlled caching logic can be found here, which outlines how service workers manage fetch events, caching layers, and background updates. These patterns give developers clear guidance on how to align runtime behavior with javascript performance optimization goals in real-world applications with dynamic content requirements.
Choosing the Right Caching Strategy for Each Asset
Different assets benefit from different caching patterns. Static libraries often use a cache-first approach, while APIs or frequently updated data require a network-first or stale-while-revalidate strategy. Aligning each asset with the correct pattern supports javascript performance optimization by preventing outdated data from appearing while still limiting unnecessary network load. This balance ensures accuracy, speed, and consistency across the application lifecycle.
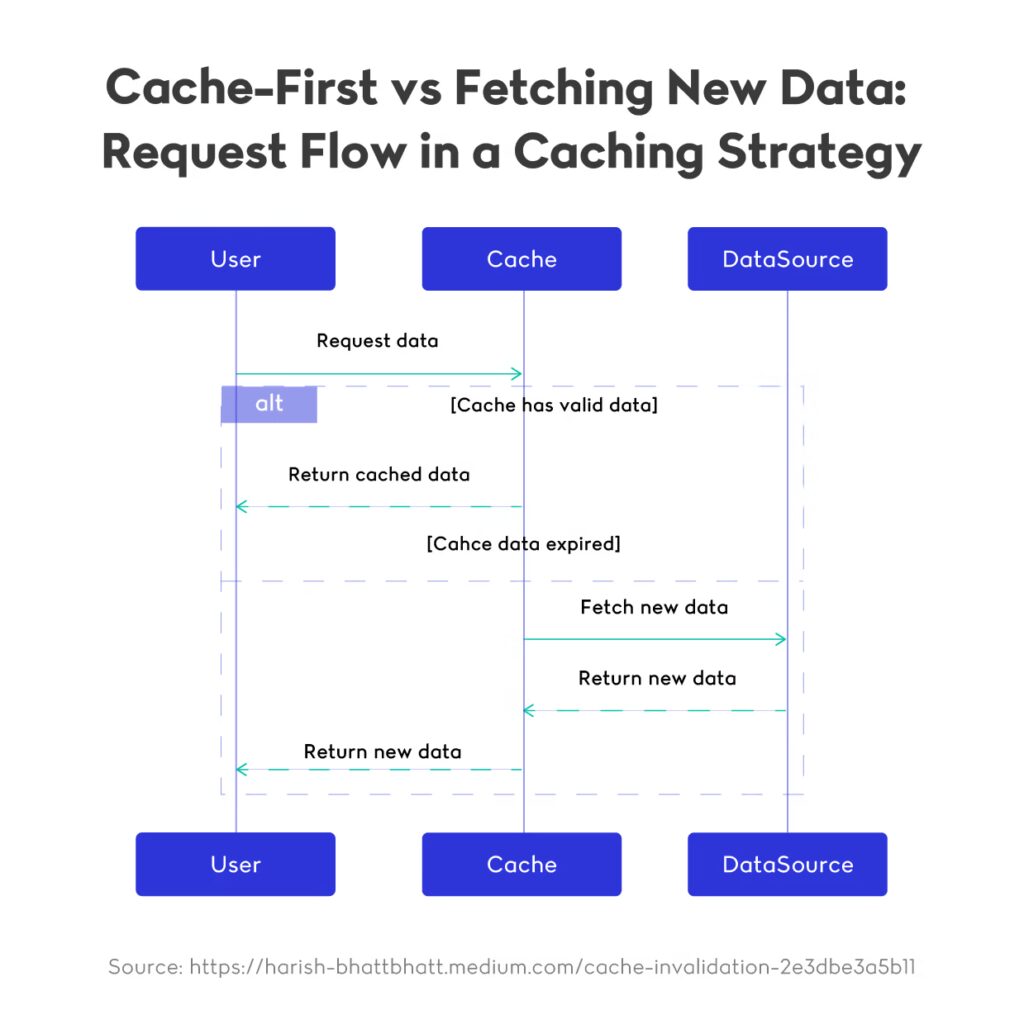
Selecting an appropriate strategy also depends on how user interactions evolve throughout a session. Assets that support initial rendering often benefit from a cache-first approach, while assets tied to dynamic content may require a validation step to avoid outdated responses. Evaluating how often each asset changes, how critical its freshness is, and how expensive it is to fetch allows teams to make decisions that support predictable and stable behavior. This decision-making process strengthens javascript performance optimization because it ensures that caching systems not only reduce network usage but also maintain relevance and accuracy for users navigating the application in real time.
Managing Cache Invalidation and Versioning
Caching is only effective when developers control how and when assets are invalidated. Versioning bundles, hashing filenames, and using manifest-based updates allow teams to force cache refreshes precisely when needed. These techniques are fundamental to javascript performance optimization because they prevent users from running outdated code while still benefiting from long-lived cached assets. Proper invalidation planning ensures reliable rollouts and predictable behavior across deployments.
Ensuring Caching Scales with the Application
As applications grow, caching rules may need to be adjusted to accommodate new asset types, routes, and performance constraints. Periodically auditing caching behavior ensures that earlier rules remain effective and that new features do not introduce avoidable network overhead. Incorporating this review process into development cycles reinforces javascript performance optimization by maintaining consistent load performance as the application evolves.
Sustaining High Performance Through Continuous Optimization
Achieving long-term speed and reliability requires treating javascript performance optimization as an ongoing practice rather than a single milestone. As applications evolve, new features, dependencies, and architectural decisions affect how efficiently code loads and executes. Maintaining a consistent focus on javascript performance optimization ensures that each update strengthens the user experience instead of introducing unnoticed regressions. This mindset encourages teams to analyze performance data regularly, revisit earlier decisions, and adjust strategies to align with current user behavior and device capabilities.
Sustained improvement depends on understanding that javascript performance optimization involves multiple layers working together. Accurate measurement, thoughtful loading strategies, efficient bundling, and robust caching all contribute to faster interactions and smoother rendering. When these techniques operate in harmony, applications become more resilient to growth and better prepared for changing performance expectations. Regular audits help verify that each layer continues to support javascript performance optimization as new requirements emerge.
Developers who integrate performance considerations into their daily workflow benefit from fewer interruptions caused by unexpected slowdowns. Treating javascript performance optimization as a shared responsibility across teams leads to more deliberate coding patterns, clearer architectural decisions, and higher overall quality. Over time, this consistent attention to detail results in applications that remain responsive even as complexity increases.
Looking ahead, new APIs, evolving browser capabilities, and advancements in build tooling will continue to influence how javascript performance optimization is applied. Teams that stay informed and adapt readily to these changes will be better positioned to maintain competitive performance standards. Applying the principles outlined in this guide offers a reliable foundation for ongoing refinement and ensures that each iteration of the application delivers a faster, more stable experience for users.